Over the last year Opsian have been implementing Continuous Profiling for the Tezos platform, in this post we’ll explain how you can use the tooling.
Configuration
In order to use the Opsian agent you need to install the library from github (GitHub - Opsian/opsian-ocaml: A low overhead profiling library for the OCaml ecosystem) and then add opsian as a library dependency on your project, for example: opsian-ocaml/dune at main · Opsian/opsian-ocaml · GitHub.
When running the binary you need to set the environment variable OPSIAN_ARGS. For example:
export OPSIAN_OPTS="apiKey=ABCDEF,applicationVersion=1.337,agentId=£{PID}-app"
In this example we’re providing an api key to let Opsian’s server know which app our agent is associated with, an application version which is a searchable field within the app and an agent id that identifies the process id in question and can be used to correlate with other monitoring systems.
Opsian User Interface
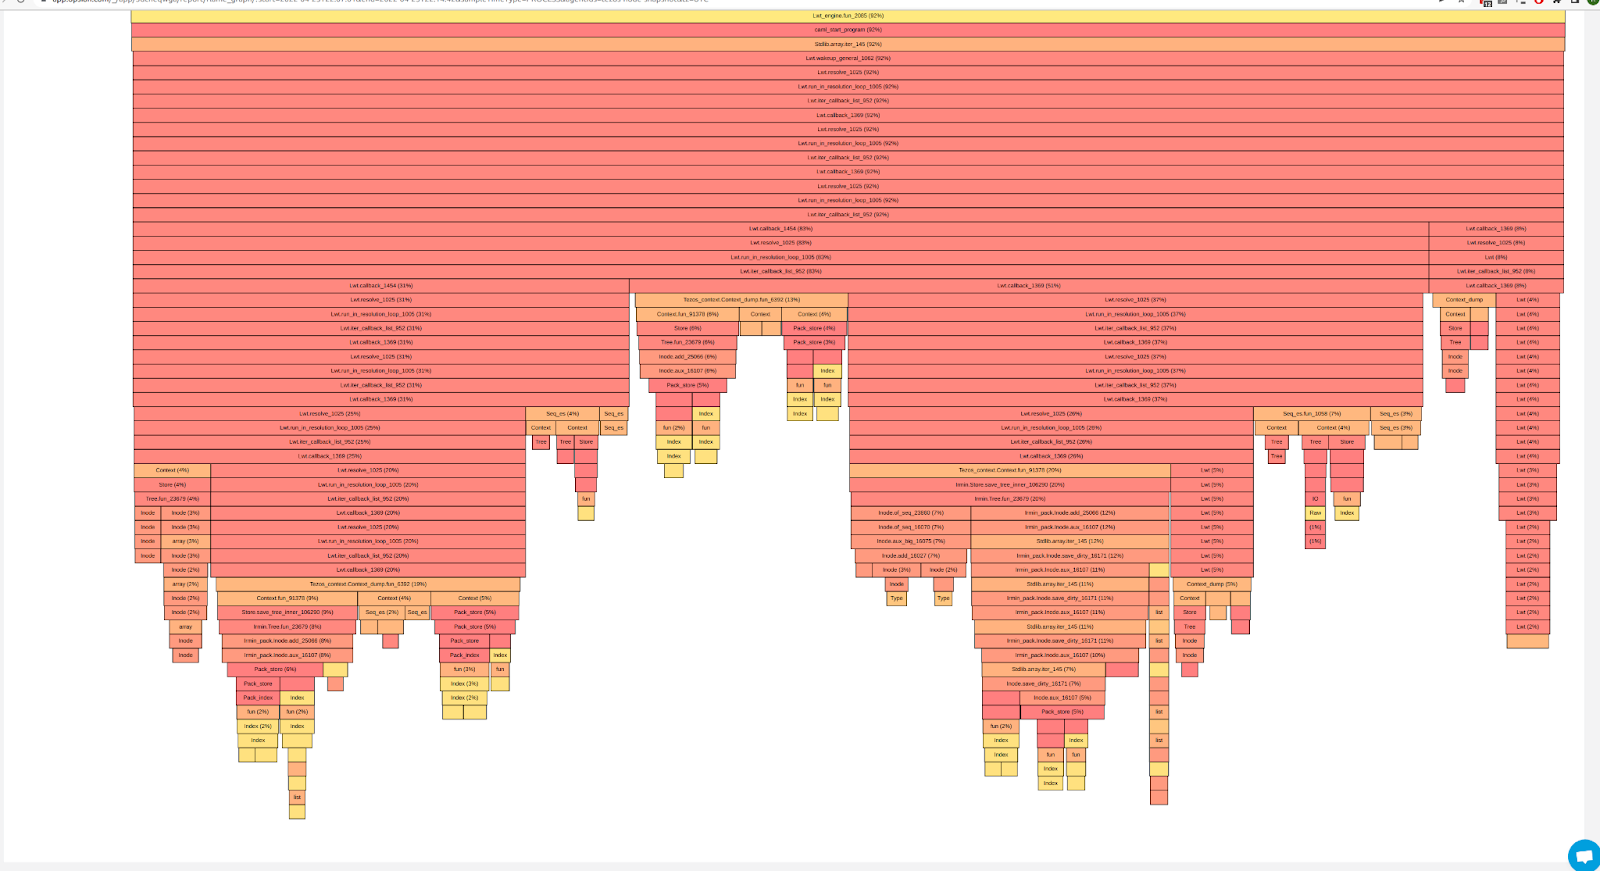
Having connected the agent to Opsian’s UI you’ll get two types of information: flamegraphs with profiling information and charts of metrics within the system.
Flamegraphs are a profiling visualization invented by Brendan Gregg, see his website (Flame Graphs) for more information. Our profiling data is collected with < 1% overhead, and we collect both CPUTime and also Wallclock time profiling data. Either can be selected as a choice within our UI.
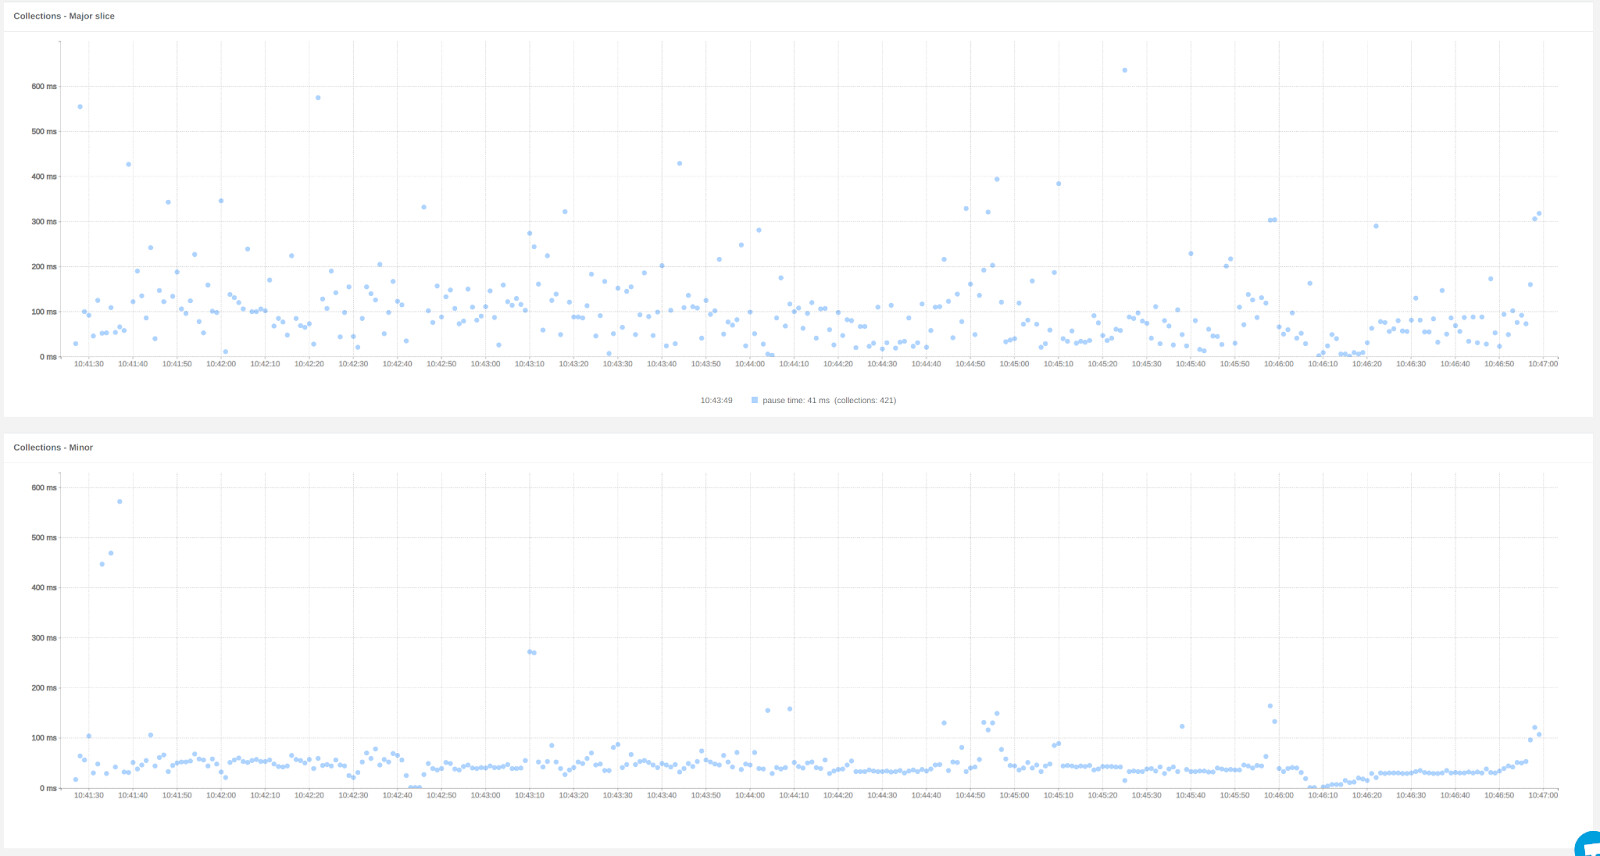
If you have an OCaml version with runtime_events enabled then you can also see a range of Garbage Collection information in our User Interface. Runtime_events will be described in detail in a future Agora post. It provides a new way of exporting performance data from the OCaml runtime and has been developed by Opsian with sponsorship from Tezos.
You can see graphs of the time taken in order to perf individual Minor Collections or slices of Major collections.
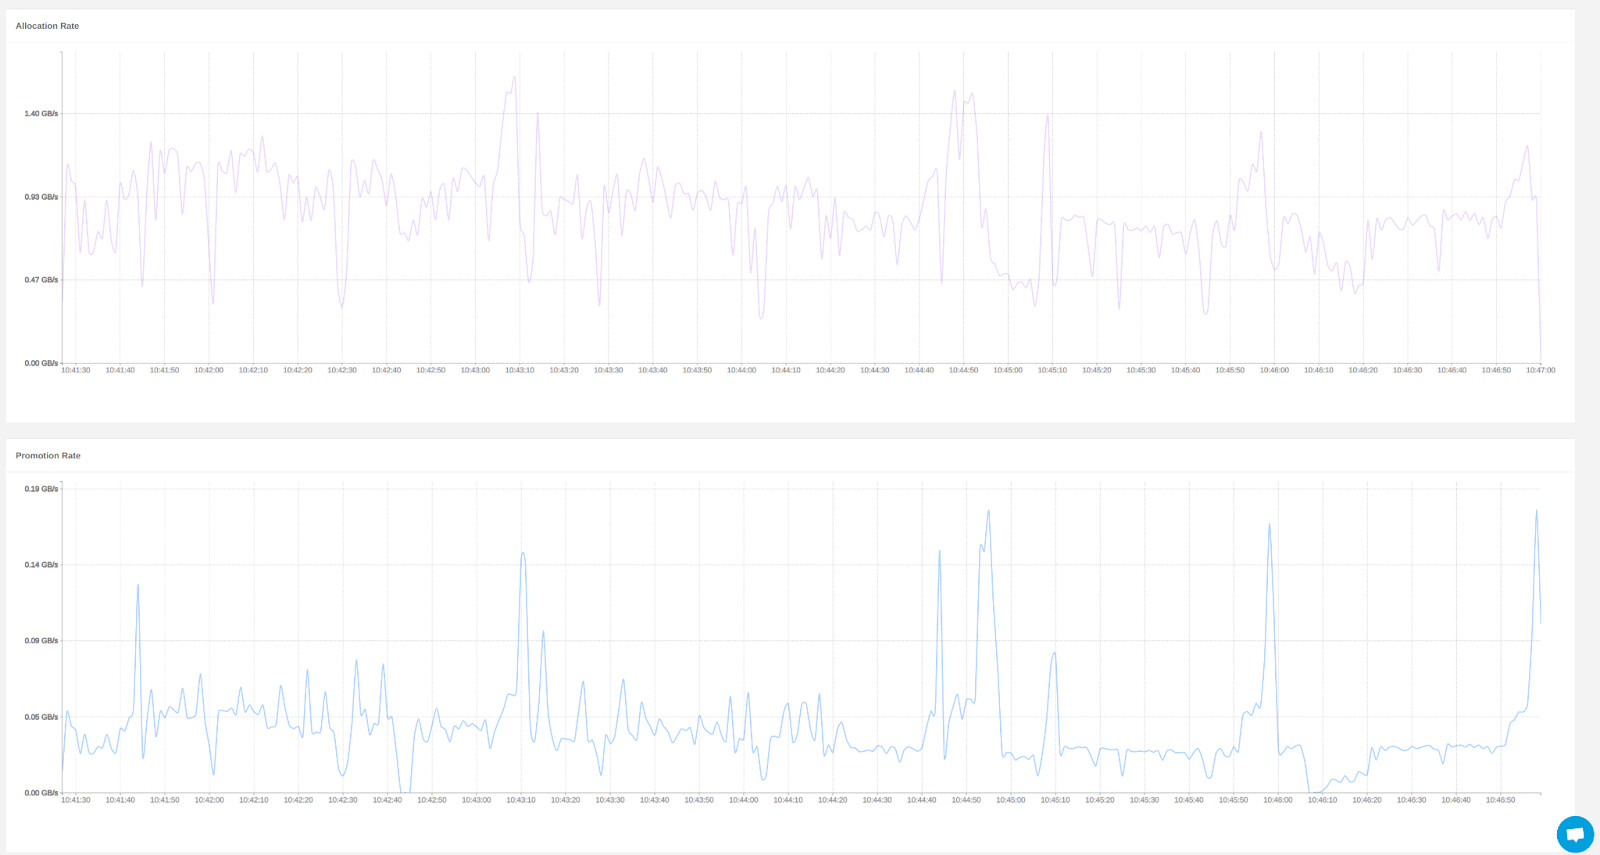
We also show information about heap allocation and promotion rates. The promotion rate is the rate at which values are promoted from the minor heap to the major heap in OCaml.
Graphs of other information is also provided, for example system and process CPU information, context switching and page fault rates and also a table of GC causes.
Prometheus and Grafana
An alternative approach to using the agent is to export data to Prometheus and Grafana. We support the export of profiling data there. This is more limited data than we can export to our User Interface but it does enable users who are already using the Prometheus and Grafana stack to incorporate our profiling data in a familiar environment.
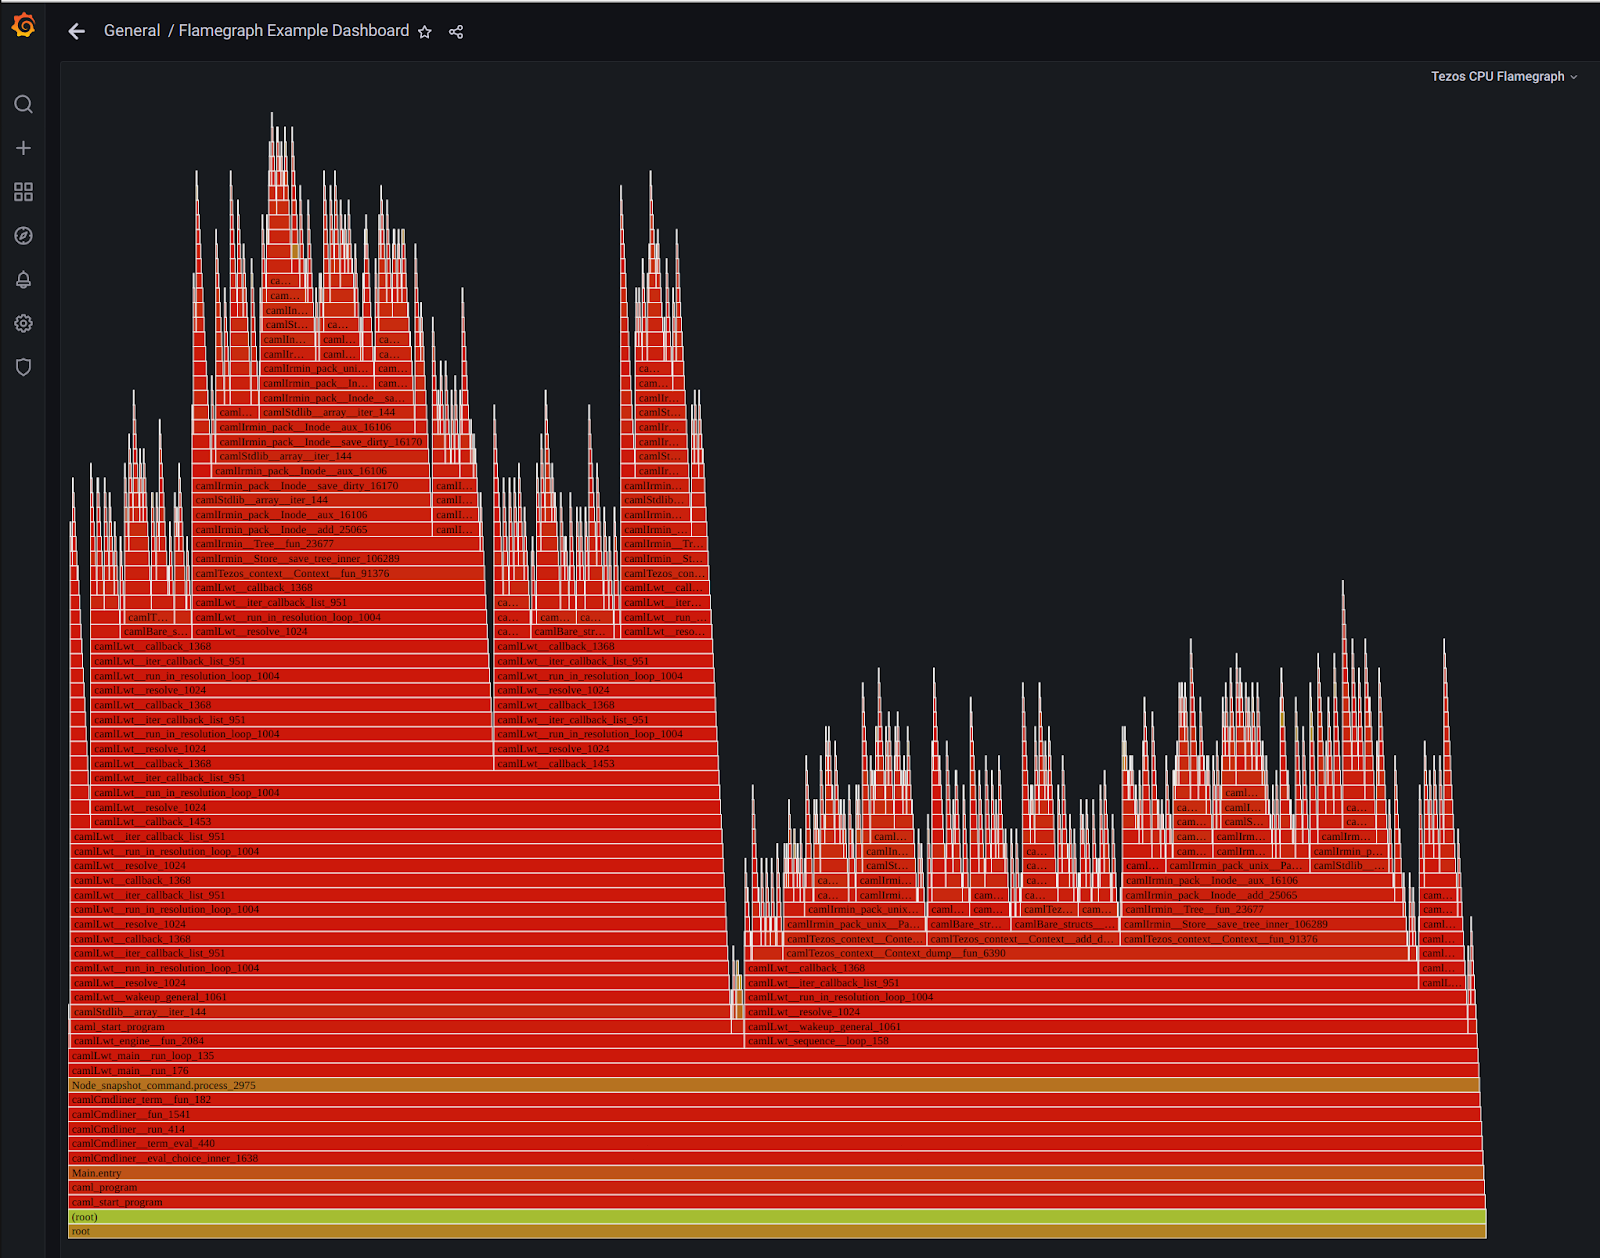
Here’s a screenshot of the profiling flamegraph:
In order to export the data to Prometheus you only need to provide a different OPSIAN_OPTS environment variable to the OCaml binary that you’re running. For example:
export OPSIAN_OPTS="prometheusPort=9100,prometheusHost=192.168.2.101,prometheusProcessSampleRate=50,prometheusElapsedSampleRate=50"
This binds a small, integrated web server to port 9100 on the specified IP address and sets the sample rates. Detailed setup instructions are available on our wiki: Exporting to Prometheus Grafana · Opsian/opsian-ocaml Wiki · GitHub. This explains how to setup your Prometheus and Grafana systems in order to ingest the data.
At Opsian we’ve also contributed improvements upstream into the OCaml runtime in order to make it easier to monitor, called Runtime Events. We’ll talk about that in our next Agora post.