Over the last year Opsian have been implementing Continuous Profiling for the Tezos platform, in this post we’ll explain how we achieve continuous profiling with low overheads.
The Opsian agent (GitHub - Opsian/opsian-ocaml: A low overhead profiling library for the OCaml ecosystem) is an OCaml library that adds continuous low overhead profiling to an OCaml program. It just needs to be added as a dependency in your dune libraries stanza. It gathers continuous cpu and wallclock profiling data and also process and system level metrics and sends them back to our hosted servers. It can also be used to profiling data back to a combination of Grafana and Prometheus.
Stack Traces
In order to gather profiling data from a running process you need to sample its stack traces. We use the operating system’s signal handling mechanism (Introduction To Unix Signals Programming) in order to interrupt the program’s threads whilst they are running. This has very low overhead. We use SIGPROF (Alarm Signals (The GNU C Library)) in order to interrupt threads in proportion to the CPUTime used. Our wallclock profiling solution periodically scans the threads within the system (using data from /proc) and sends SIGALRM signals to them to trigger profiling.
Once you’ve interrupted the program’s threads, the next problem to solve is to walk the stack. The neatest solution to this would be to use the x86 frame pointer which points to the previous stack frame. Unfortunately, requiring frame pointers necessitates not only a specific OCaml compiler but also user-space libraries be compiled specifically too. This would not be compatible with the profiling approach being usable as part of the Tezos distribution - which users might run on arbitrary configurations.
The DWARF debug information can be used to unwind both stacks from native C code, which might be called by OCaml code, and also OCaml code itself but this poses two issues. Firstly, unwinding using DWARF is not particularly quick. It involves executing a state machine that reverses changes to registers and the stack at each step. The second issue is that there are concerns as to the accuracy and correctness of the DWARF information emitted for some OCaml functions, certainly we and other users have witnessed broken call stacks when using DWARF-only profiling with perf.
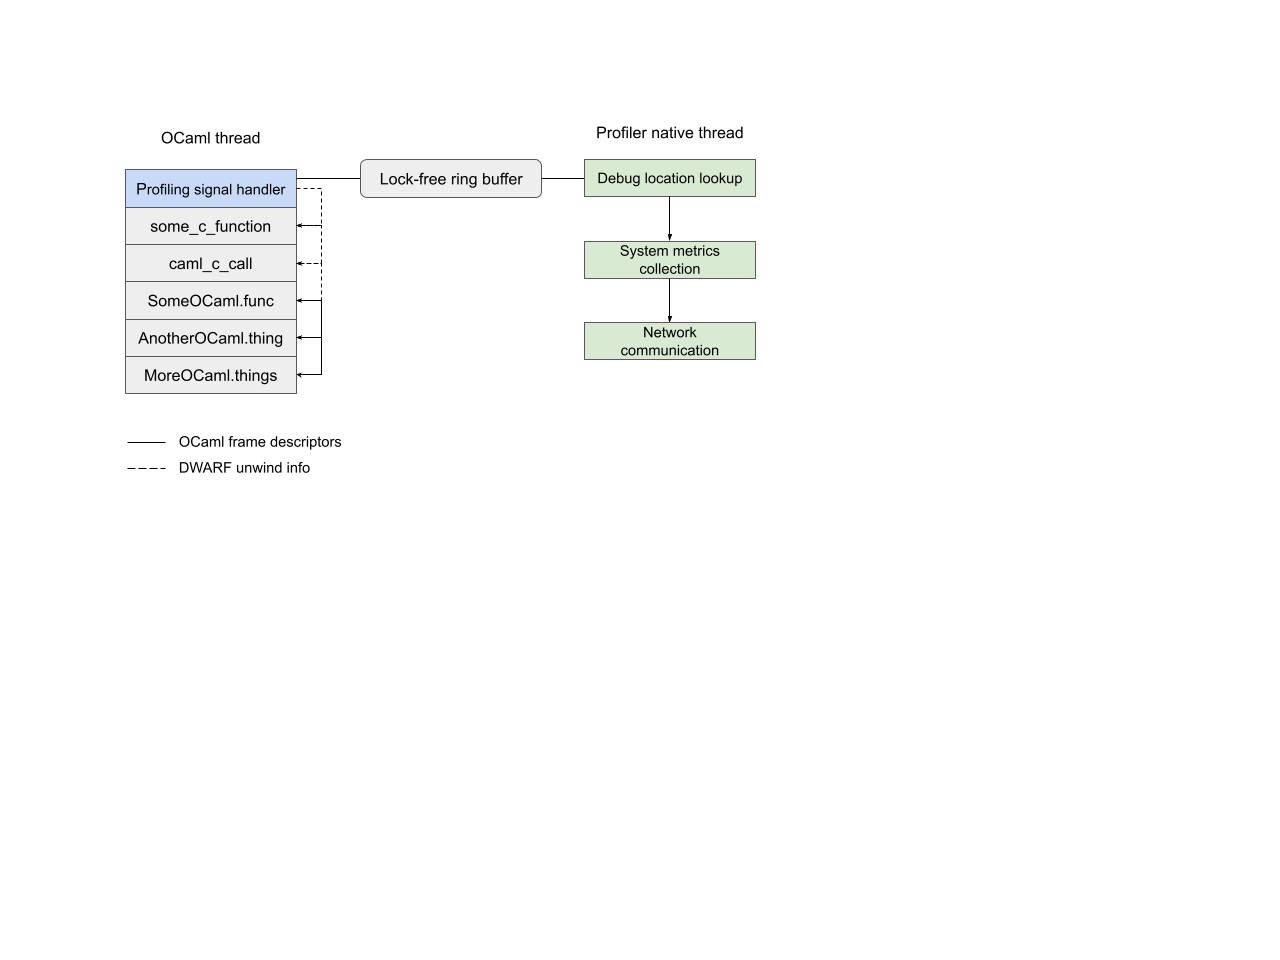
OCaml’s frame descriptors, distinct from frame pointers - which are an Application Binary Interface (ABI) property, are tables emitted by the compiler for the purposes of walking the stack during an OCaml garbage collection. This data is required by the runtime and so is always emitted and it is correct - if it is not then the GC crashes. It is also orders of magnitude faster to unwind than DWARF.
Our profiler uses Frame Descriptors to walk portions of the stack that are compiled from OCaml code - the overwhelming majority. We fallback toDWARF debug information to unwind C based stacks. You can generally rely on C code to be a short sub-section of the stack that is therefore quick to unwind and have correct DWARF information, resolving both the problems with DWARF.
Data Collection
Finally once we’ve walked through the stack we need to extract this information and send it back to our servers. We want to minimize the code running within our signal handler both to avoid blocking the application thread for too long and also because signal handlers are only allowed to call async-safe code (signal-safety(7) - Linux manual page) which means most C libraries can’t be used there. For example, any code that calls malloc or uses a lock.
Our solution to this problem is to write the stack traces into a lock-free, non-blocking, ring buffer from the signal handler. Our agent also runs a background thread that reads from this ring buffer, collects metrics, looks up debug symbol information and sends the data back to our server over the network.
We’ve benchmarked our approach with Tezos snapshot restore and concluded the overhead was a < 1% throughput impact. Our next Agora update will talk about how to use the agent and show the UI.


