Over the last year Opsian have been implementing Continuous Profiling for the Tezos platform, in this post we’ll explain first what problem it solves and then what it is.
What problem are we trying to solve?
In order to have a fast, scalable and low cost Tezos platform it’s important to be able to perform optimizations on the core platform. Often making code faster is a really fun activity that developers love to do, but when you’ve got a mature platform with a size-able codebase it’s hard to know what code to optimize. Experience shows that normally only a few small areas of a codebase, the performance hotspots, are dominant in terms of the number of CPU cycles they use up and that profilers can help us identify the hotspots within a program.
The traditional methodology for using profilers, used due to their overhead, is to write performance tests against the software that you’re trying to optimize and then profile the code under this load. Unfortunately this can be a flawed methodology.
Your performance testing results might be inaccurate due to several factors:
- Unrepresentative Hardware. The hardware that you’re running your performance test on has different performance characteristics for CPU or IO to your production system so that it exhibits a different bottleneck to your real system.
- Unrepresentative Software. The software version used in your performance test is different in your test environment to your production system. This could entail running on a different operating system version. Sometimes small patch versions can alter performance dramatically: for example one Windows security patch tanked UDP throughput by 40% in some benchmarks.
- Unrepresentative Workloads. This is behaviour that differs from the real world load on a system. This results in the wrong code paths in the application being tested and the profiling looking at the wrong parts of the codebase.
Continuous Profiling solves these problems by profiling a real-world running system.
Continuous Profiling
If we can profile production at low overhead, why not do it all the time? This approach is called Continuous Profiling and it has many advantages over ad-hoc profiling. Server access-related issues disappear as once the continuous profiler has been set up, access to the servers is no longer needed when diagnosing an issue. Having current and historic profiling data easily accessible also brings a bunch of benefits. For example being able to compare profiling data before and after releases of new versions of software or hardware upgrades in order to see if bottlenecks have moved.
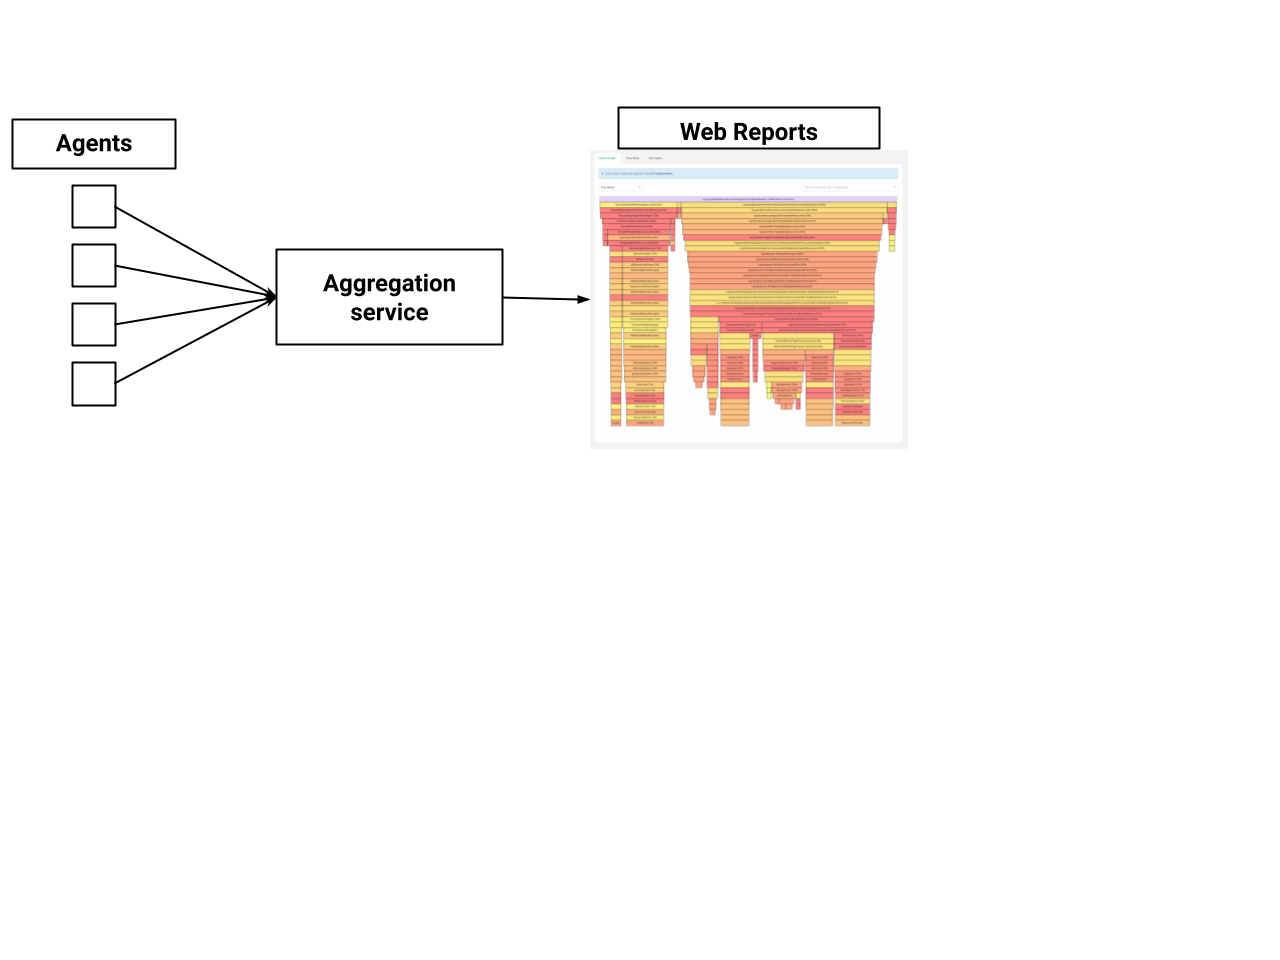
Continuous Profiling also entails a change in the architecture of software profilers. Traditional profilers offer a Desktop oriented UI or a commandline tool. In the new era of continuous profiling we need to continuously export the data off of the server being profiled, aggregate the profiling data on a server so that developers, in different time zones and organisations can collaborate on a shared, accurate and fully-representative view of the data.
One thing we witness often with developers using Continuous Profiling is the realisation that the assumptions and mental models they use during development for the cost of operations or the nature of data are incorrect. We’ve seen significant reductions in load from our other customers simply switching the order of certain filters based on their actual costs in production rather than the assumed cost at development time.
Thankfully at Opsian we’ve solved the problem of being able to continuously profile at really low overheads, we’ll talk about our technical approach in our next Agora post.