Standard node dashboards cover chain-level metrics: head level, peer count, resource usage. Delegate-level health — missed attestation slots, DAL participation sufficiency, remaining grace period before deactivation — lives in a different data set: the delegate RPCs of the Octez node.
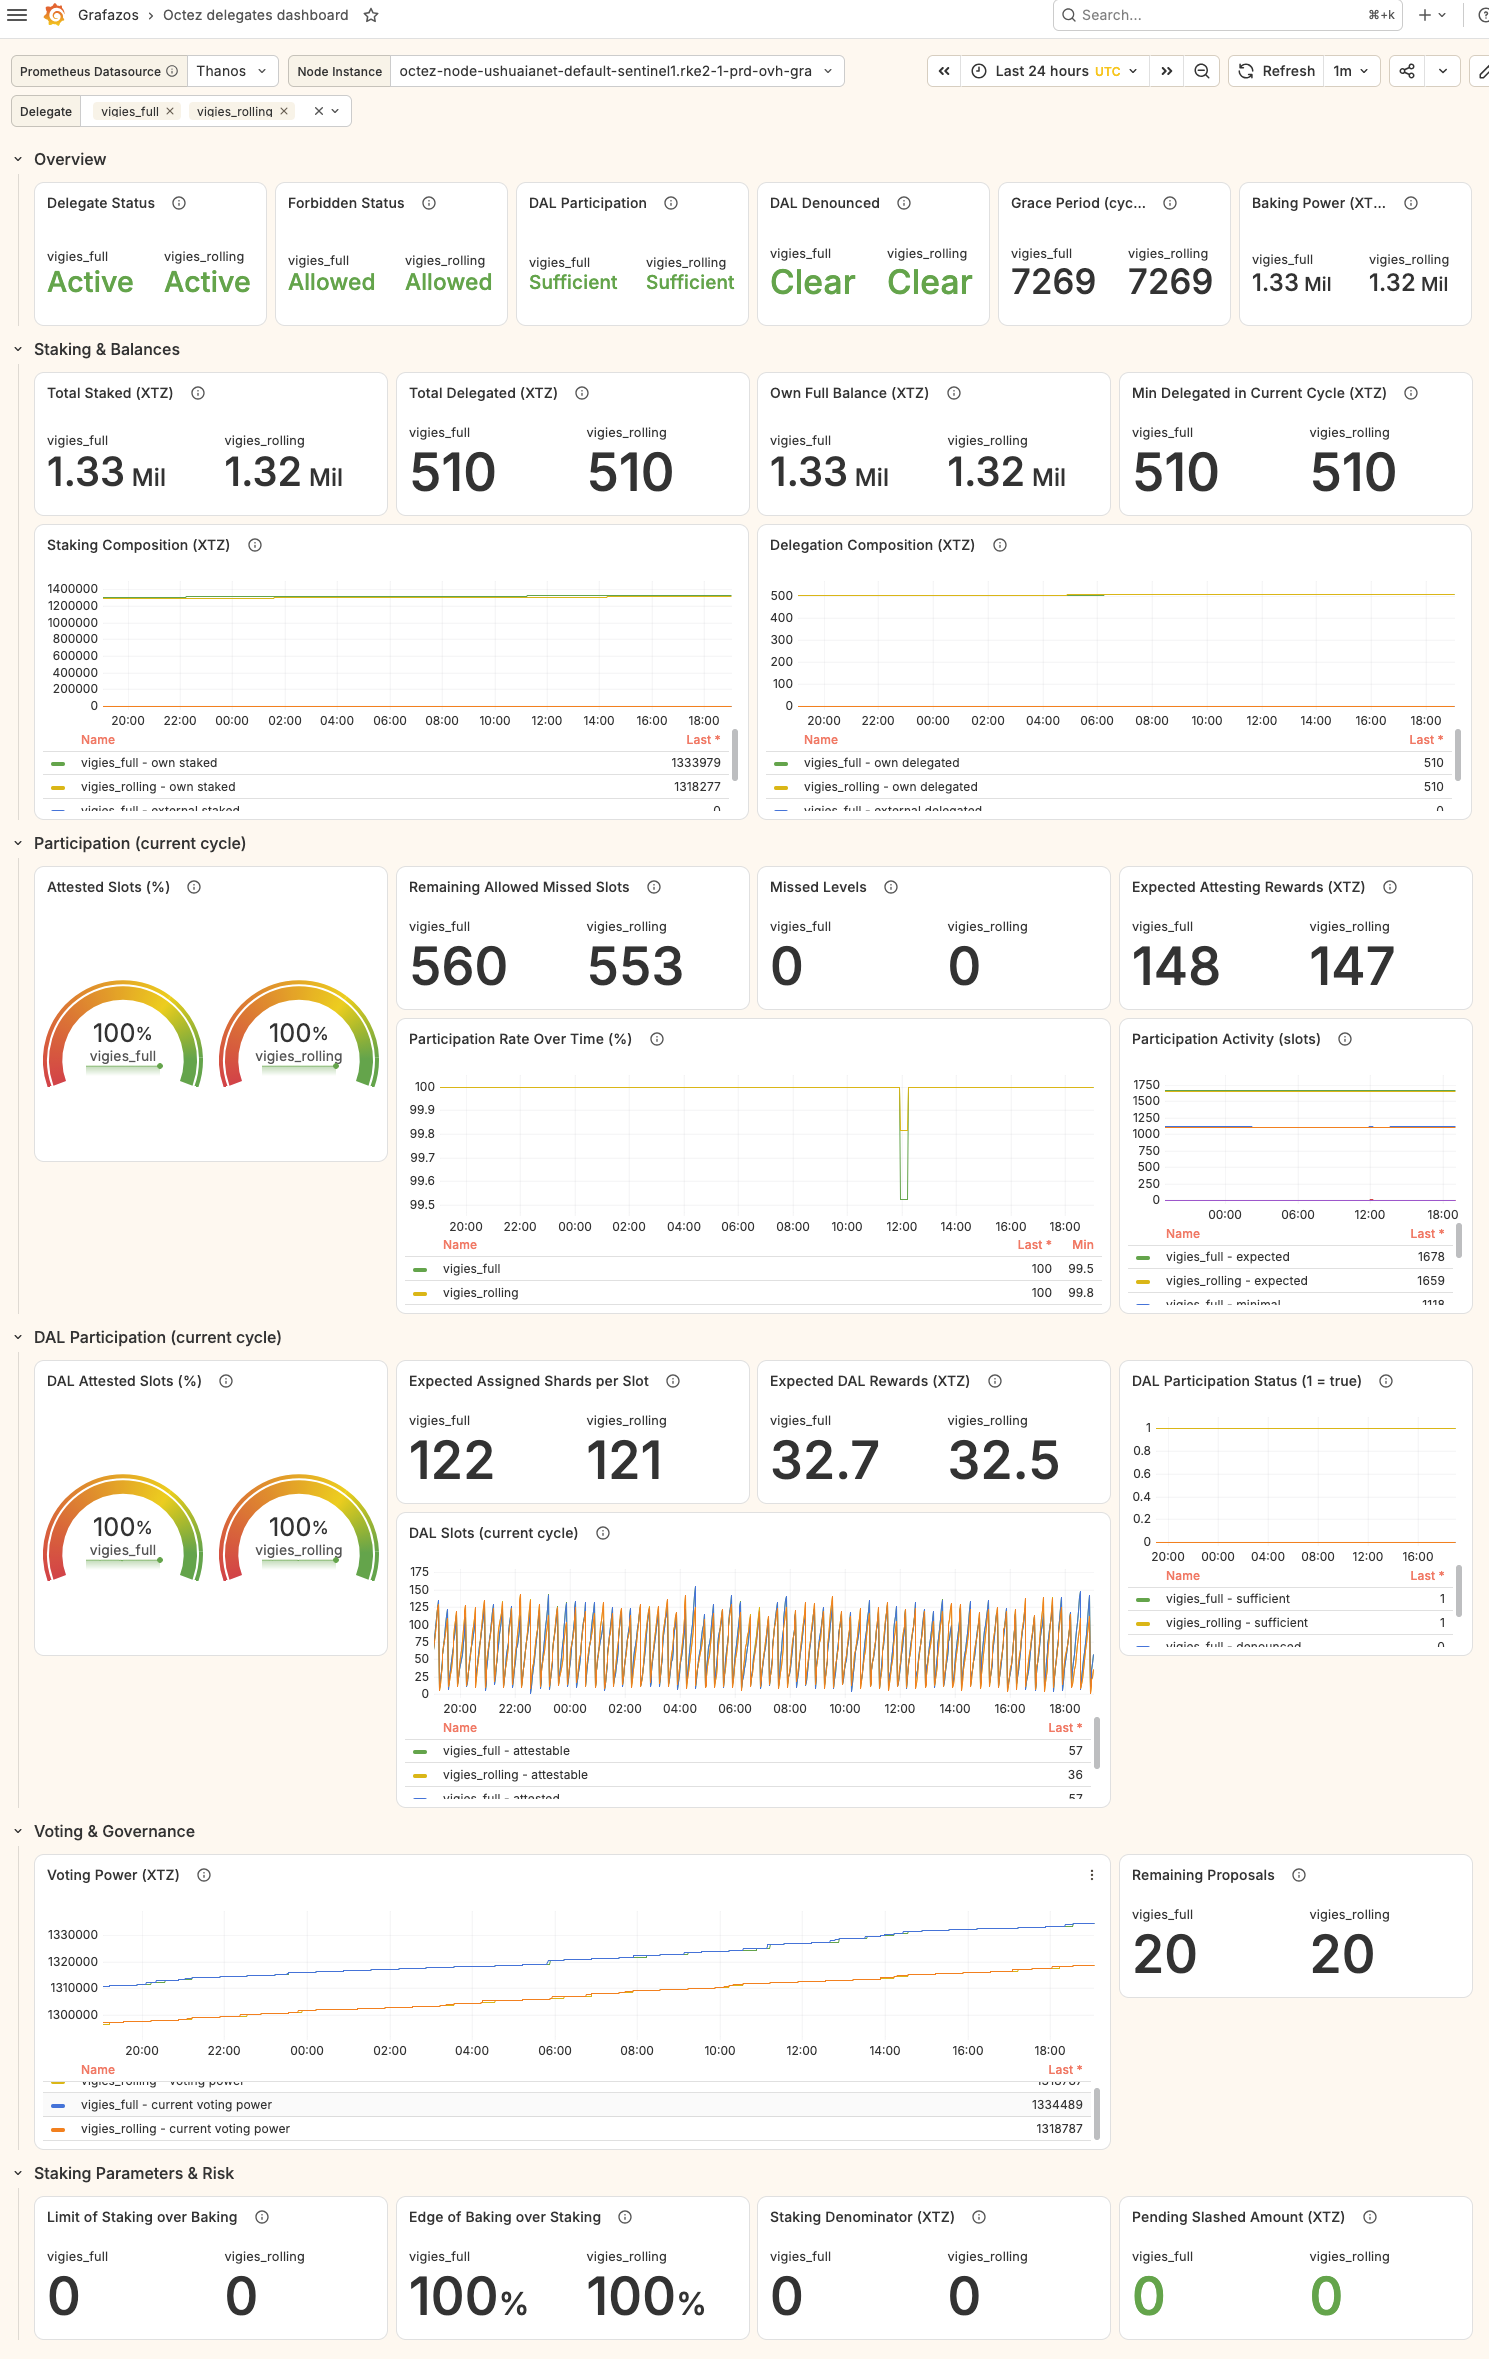
This post describes an end-to-end pipeline that turns those RPCs into Prometheus metrics and visualizes them with the octez-delegates dashboard that now ships in Grafazos, the official Octez dashboard collection. The data comes entirely from the node itself — no indexer or third-party API is involved.
Octez node RPC ──> json-exporter ──> Prometheus ──> Grafana (Grafazos octez-delegates)
How it works
The prometheus-community/json-exporter probes the delegate RPCs of the node and converts the JSON fields into Prometheus gauges. Each metric group is one exporter module probed against a field-specific sub-RPC:
/chains/main/blocks/head/context/delegates/<address>/participation
/chains/main/blocks/head/context/delegates/<address>/dal_participation
/chains/main/blocks/head/context/delegates/<address>/baking_power
...
Metric names follow a simple contract: octez_delegate_ + the flattened (dot → underscore) JSON path of the RPC field. .participation.missed_slots becomes octez_delegate_participation_missed_slots, so the whole metric set is discoverable from the RPC documentation alone. Booleans are exported as 0/1 gauges; balances are in mutez. This naming contract is exactly what the Grafazos delegates dashboard consumes.
 One important rule: never probe the full delegate object
Scraping /context/delegates/<address> (the full object, no field) is the obvious shortcut and must be avoided. On mainnet, ~95% of that response’s cost and payload is the delegators list, which no metric uses. When the scrape timeout is shorter than the time the node needs to enumerate delegators, the exporter cancels and re-issues the query every interval — which can pin the node’s single-threaded RPC handling at 100% and starve RPC, metrics and even P2P for every other client. This failure mode has been observed in production on mainnet nodes.
Field-specific sub-RPCs are cheap, bounded, and return exactly what the metrics need.
Step 1 — Export the metrics
json-exporter runs alongside the node (systemd unit, container, or sidecar — any deployment method works) and needs two pieces of configuration: its own `config.yml` defining the metric modules, and a Prometheus scrape job per delegate per module.
A trimmed `config.yml` for the json_exporter (more modules follow the same pattern — the naming contract above gives the metric name for any RPC field):
modules:
  delegate_participation:
    headers:
      Accept: application/json
    metrics:
      - name: octez_delegate_participation_expected_cycle_activity
        help: Expected attestation slots in current cycle
        path: '{ .expected_cycle_activity }'
      - name: octez_delegate_participation_missed_slots
        help: Missed attestation slots in current cycle
        path: '{ .missed_slots }'
      - name: octez_delegate_participation_remaining_allowed_missed_slots
        help: Slots that can still be missed before losing attesting rewards
        path: '{ .remaining_allowed_missed_slots }'
  delegate_baking_power:
    headers:
      Accept: application/json
    metrics:
      - name: octez_delegate_baking_power
        help: Delegate baking power in mutez
        path: '{ @ }'   # scalar sub-RPC: extract the document root
And the matching Prometheus scrape config (one job per delegate per module; json-exporter listens on 7979 by default):
scrape_configs:
  - job_name: delegate_participation_mybaker
    metrics_path: /probe
    scrape_interval: 30s
    scrape_timeout: 10s
    params:
      module: [delegate_participation]
      target:
        - "http://127.0.0.1:8732/chains/main/blocks/head/context/delegates/tz1YourDelegateAddressHere/participation"
    static_configs:
      - targets: ["localhost:7979"]
        labels:
          delegate: "tz1YourDelegateAddressHere"
          delegate_name: "my-baker"
Exported metrics
The default set, per delegate:
- Status —
octez_delegate_deactivated,octez_delegate_is_forbidden,octez_delegate_grace_period - Participation (current cycle) — expected/minimal cycle activity, missed slots, missed levels, remaining allowed missed slots, expected attesting rewards
- DAL participation (current cycle) — attestable vs attested DAL slots, expected DAL rewards,
sufficient_dal_participation,denounced - Staking & balances — baking power, total/own/external staked and delegated, minimum delegated this cycle, pending slashed amount, staking parameters
- Voting — voting power, current voting power, remaining proposals
Step 2 — The dashboard
Grafazos (the jsonnet-based Octez dashboards, in the tezos/tezos repo under grafazos/) includes an octez-delegates dashboard built on these exact metric names: an overview row (activity & status), then sections for staking & balances, current-cycle participation, DAL participation, voting & governance, and staking parameters & risk — filterable per delegate through a dashboard variable.
Building it requires jsonnet (go-jsonnet) and, if the vendor/ directory is not populated, jsonnet-bundler:
git clone https://gitlab.com/tezos/tezos.git
cd tezos/grafazos
make install-jb    # only if vendor/ is missing
make delegates
The result lands in output/octez-delegates.json, importable in Grafana via Dashboards → New → Import against a Prometheus datasource; the delegate is selected in the variable dropdown. With several Prometheus datasources, building with make delegates DATASOURCE_SELECTION=true adds a datasource selector.
Alerting
Once the metrics exist, useful alerts are one-liners. Examples:
# Getting close to losing attestation rewards this cycle
- alert: DelegateMissedSlotsBudgetLow
  expr: octez_delegate_participation_remaining_allowed_missed_slots
        < 0.2 * octez_delegate_participation_expected_cycle_activity
  for: 15m

# DAL participation no longer sufficient for the cycle
- alert: DelegateDalParticipationInsufficient
  expr: octez_delegate_dal_participation_sufficient_dal_participation == 0
  for: 30m

# Should never happen — page immediately
- alert: DelegateDeactivatedOrForbidden
  expr: octez_delegate_deactivated == 1 or octez_delegate_is_forbidden == 1
The whole pipeline runs against the operator’s own node, scales linearly with the number of monitored delegates (one set of sub-RPC probes each), and keeps the node healthy as long as probing sticks to field-specific sub-RPCs.
Feedback is welcome — the dashboard takes contributions in the tezos/tezos repo under grafazos/.