octez-consensus-exporter observes Tezos consensus health from the vantage of a single Octez node and feeds it into a Prometheus/Thanos + Loki + Grafana stack. One exporter runs per (network, node); it is a read-only RPC client and holds no state of its own.
Repository (public): gitlab.com/tezos-infra/octez-consensus-exporter
How it works
The exporter taps two node streams at full fidelity — /monitor/heads/main and /chains/main/mempool/monitor_operations — plus a few polled helpers (block header, block operations, attestation and baking rights). From those it times each block’s path to consensus, relative to the block’s slot:
Block proposed → Preattestations → Attestations → 66% quorum → Applied
Two outputs come out of that:
- Aggregate signals → Prometheus / Thanos. Histograms and counters, every series carrying
networkandsource(the vantage identity):- Attestation rate — fraction of attesting power that attested each block.
- Reception delay by kind — how late attestations / preattestations arrived vs the slot time.
- Delay to quorum — time to reach 66% / 90% of attesting power.
- Block validation and application delay, and the round of the canonical block.
- DAL slot coverage — DAL slots each attestation marks available (pop-count of its
dal_attestationbitfield). - Missed attestations / blocks, and held operations (branch-delayed / -refused in the mempool).
- Exact per-event records → Loki. One structured JSON line per consensus event (
block,attestation,preattestation,missing_block) — the exporter’s own synthesized events, carrying delegate, block hash, round and millisecond delay for drill-down.
Per-delegate detail is bounded: per-delegate series exist only for a rolling watchlist of recently-active delegates plus a fixed set, so cardinality stays bounded on mainnet. The block level is the time axis, never a label.
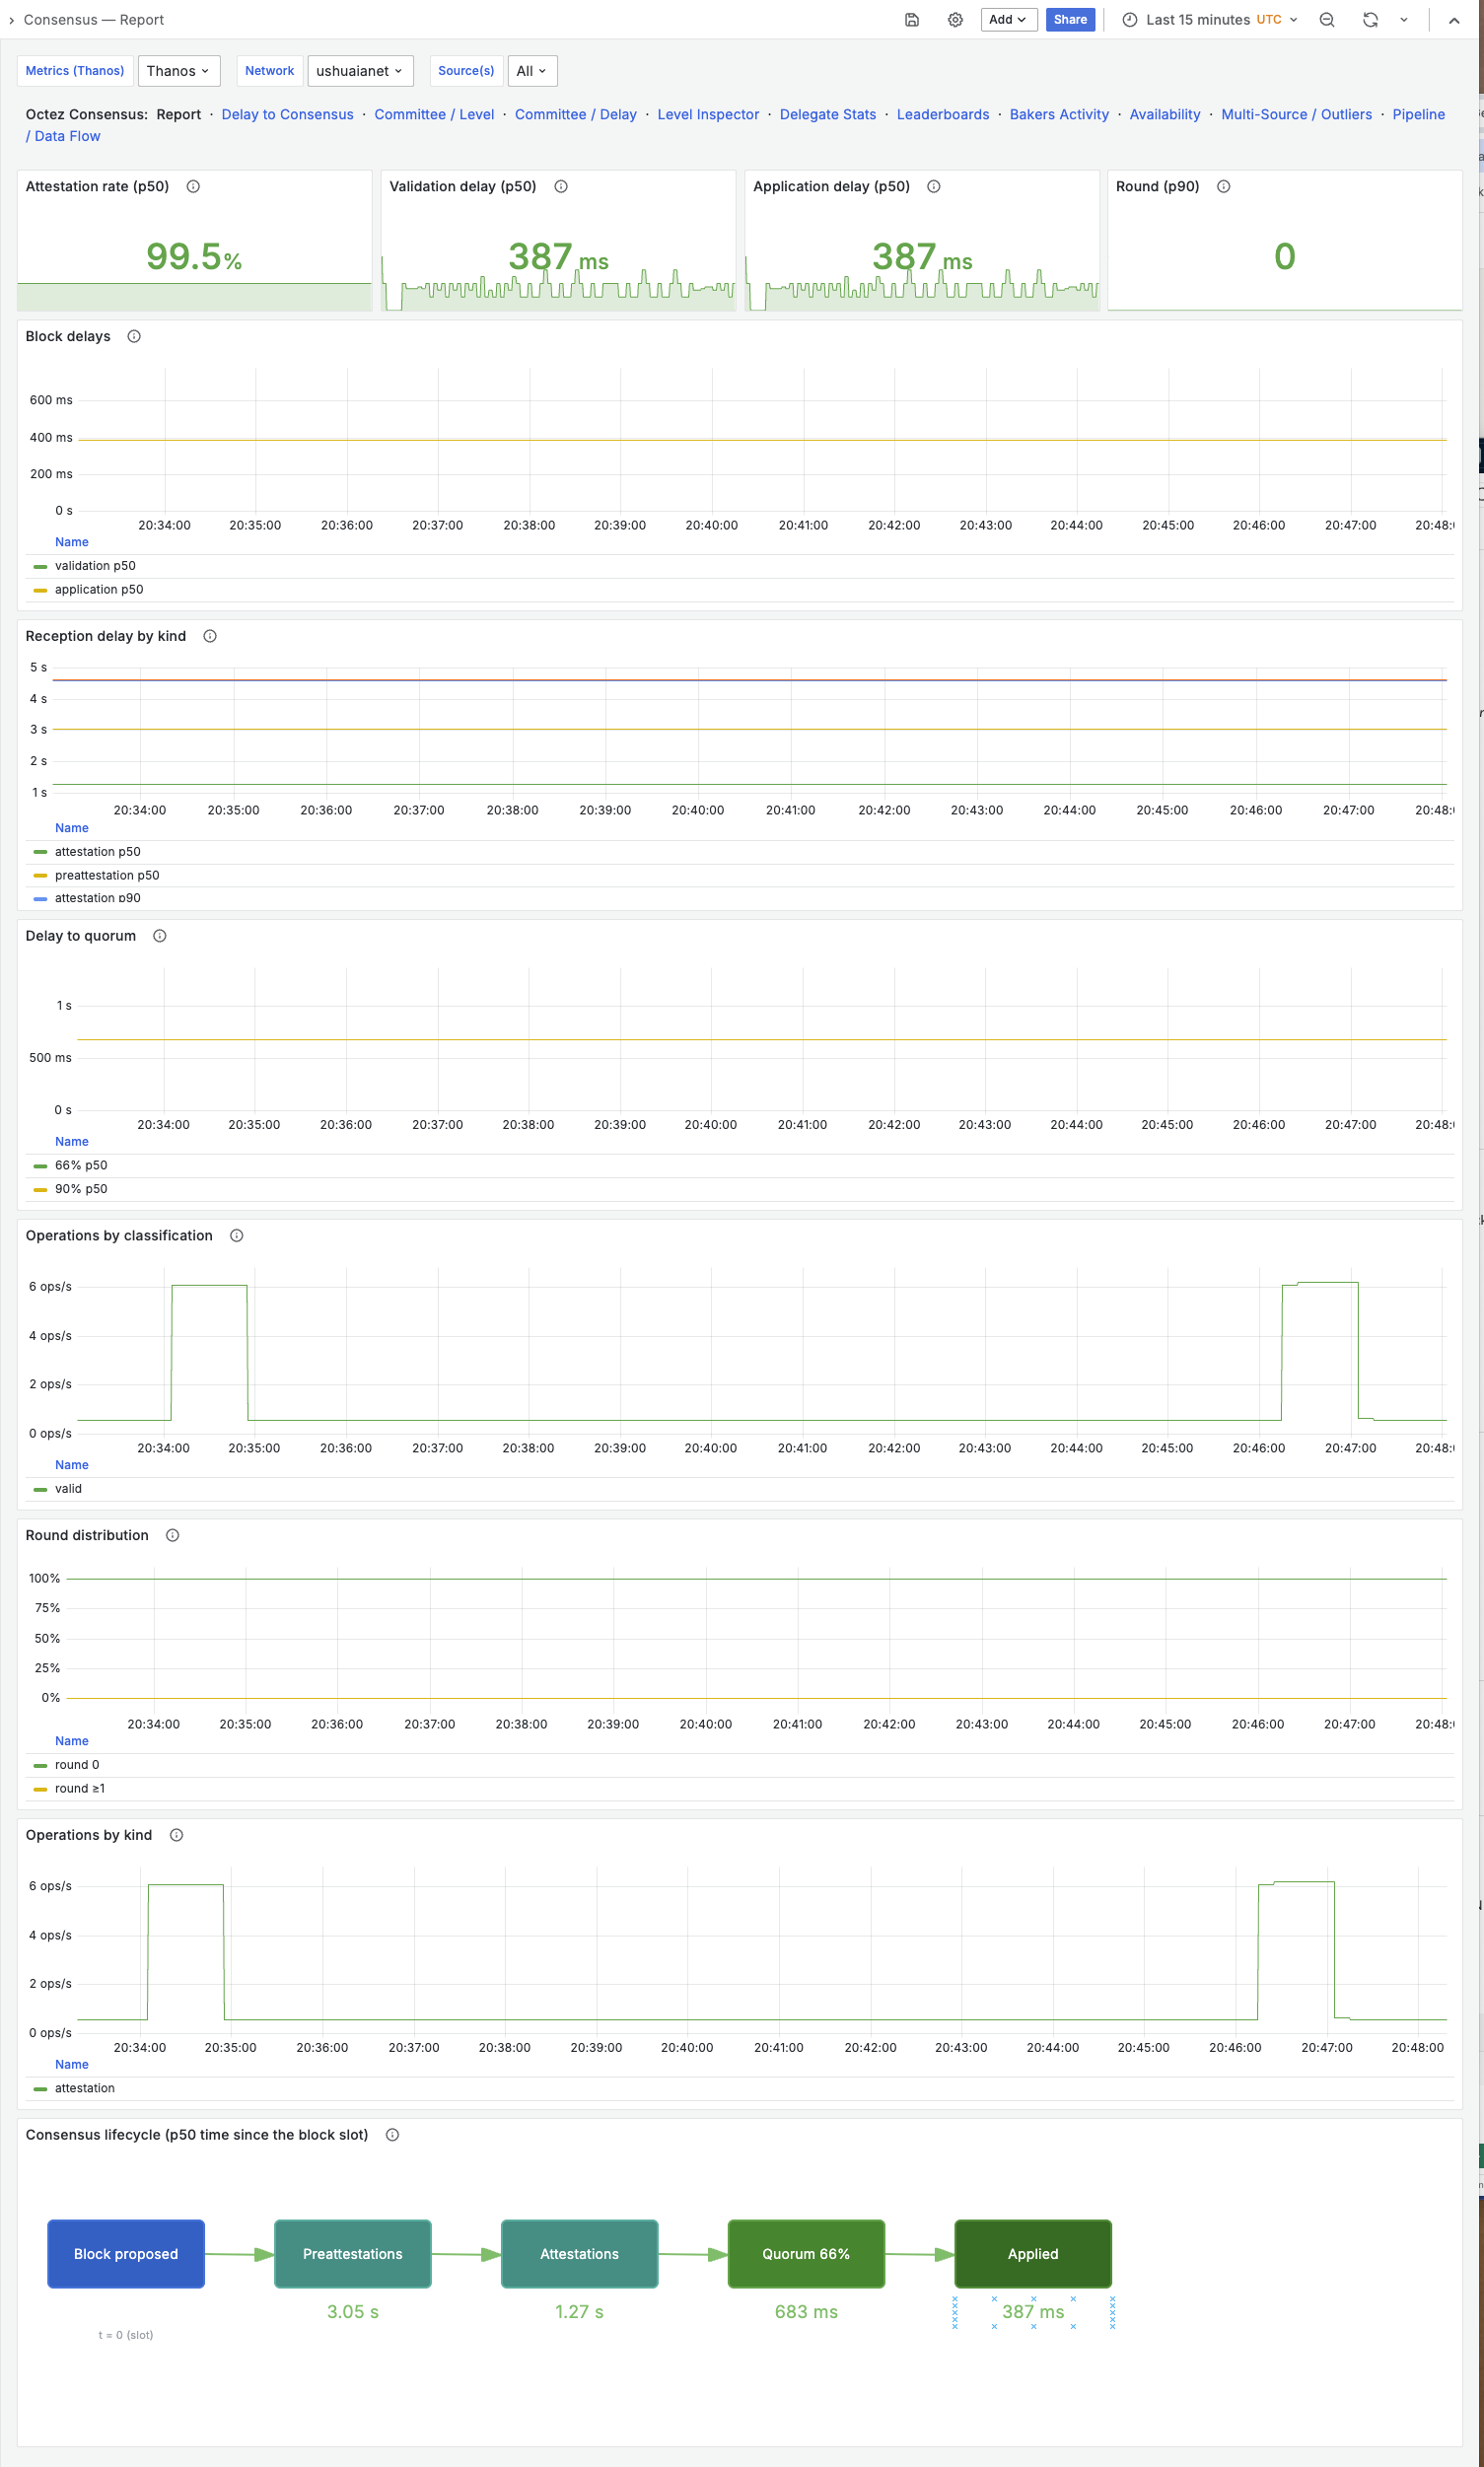
Aggregate consensus health. Screenshots are from the fixture-driven demo stack, so addresses are synthetic
tz…FAKEBAKER… placeholders.
Dashboards & alerts
Dashboards are grafonnet sources compiled in CI — one per consensus view, plus a cross-vantage outlier board and a self-observability view of the pipeline itself. Alerting ships as a PrometheusRule (low attestation rate, high delay-to-quorum, exporter down / lagging, missed attestations / blocks).
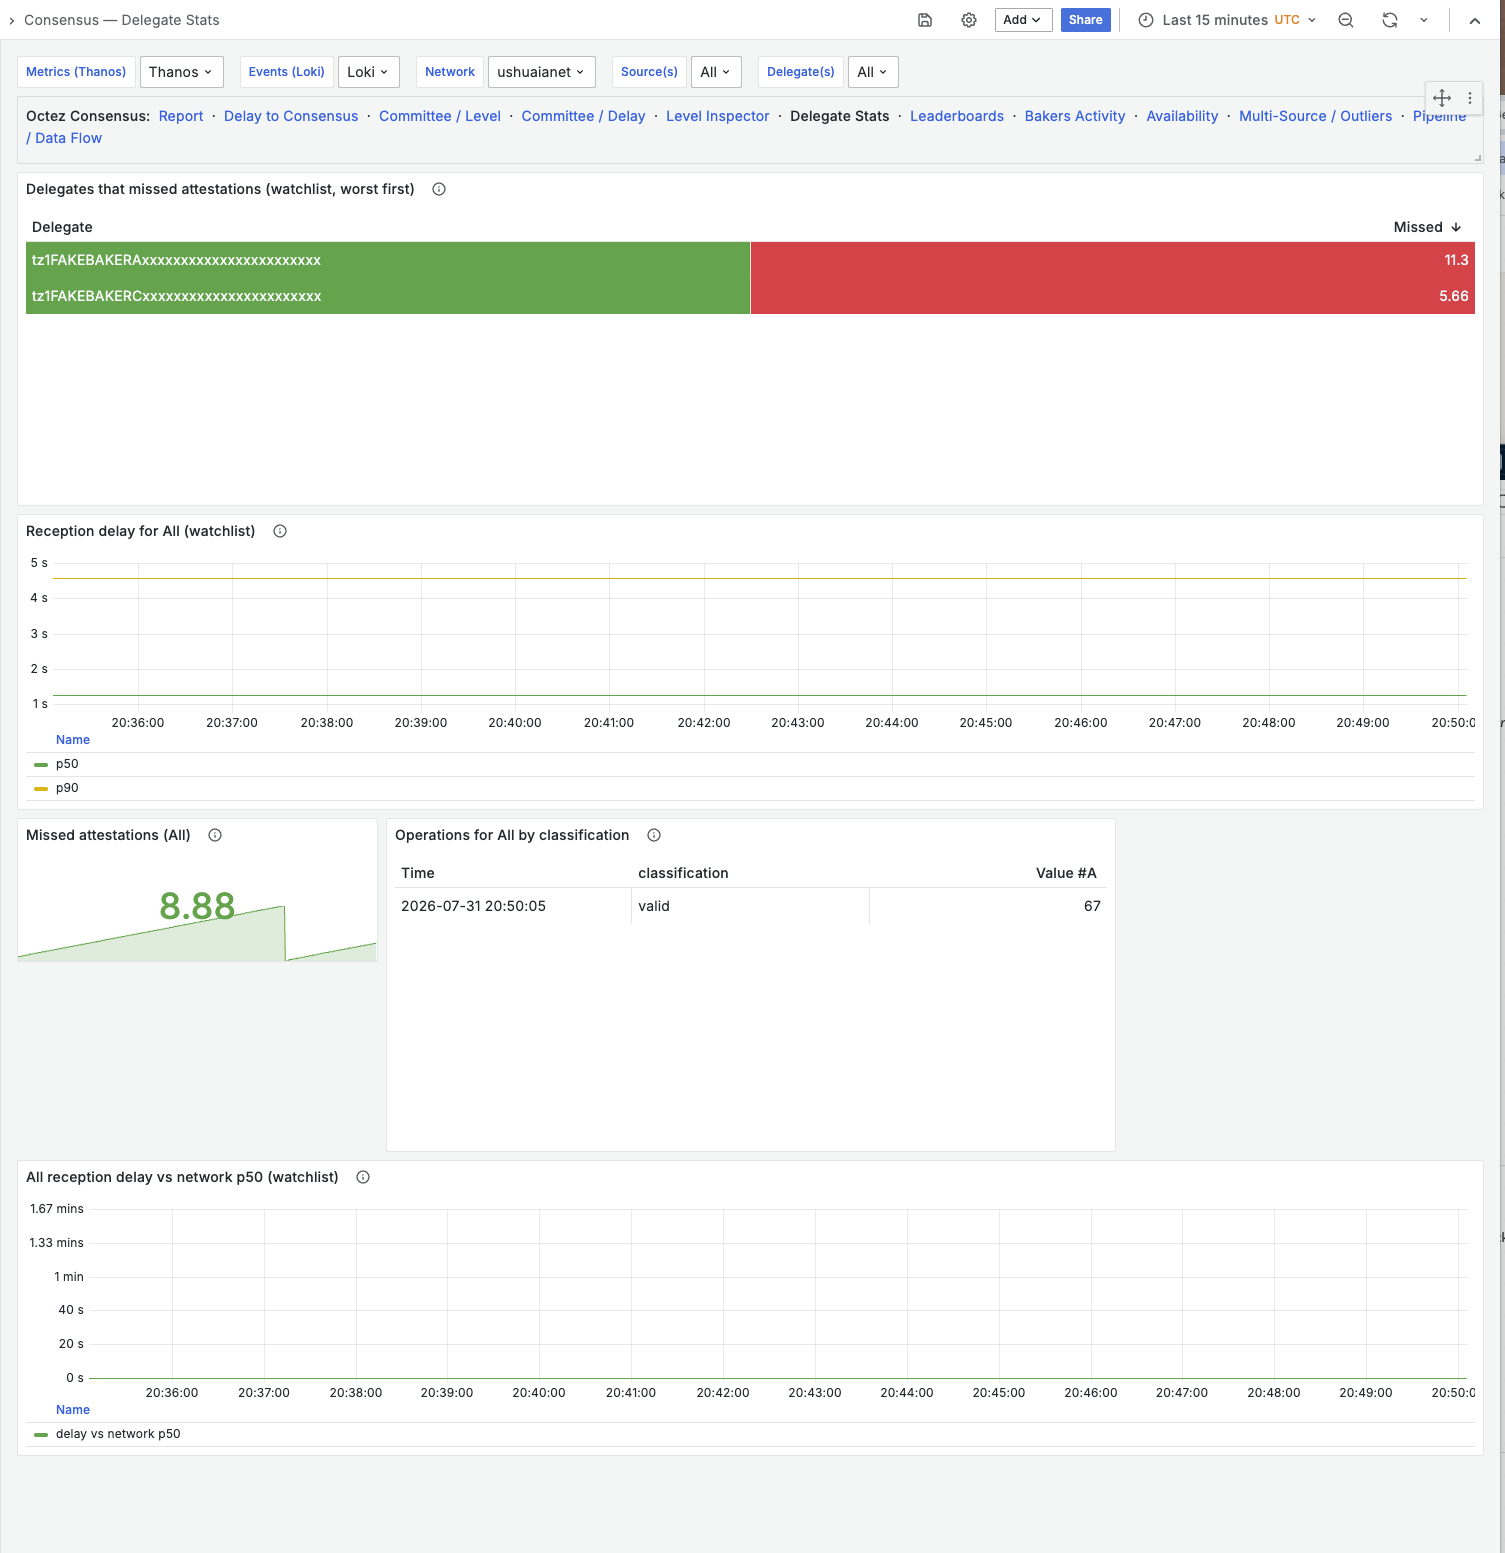
Per-delegate reception delay, deviation from the network median, and a missed-attestation watchlist.
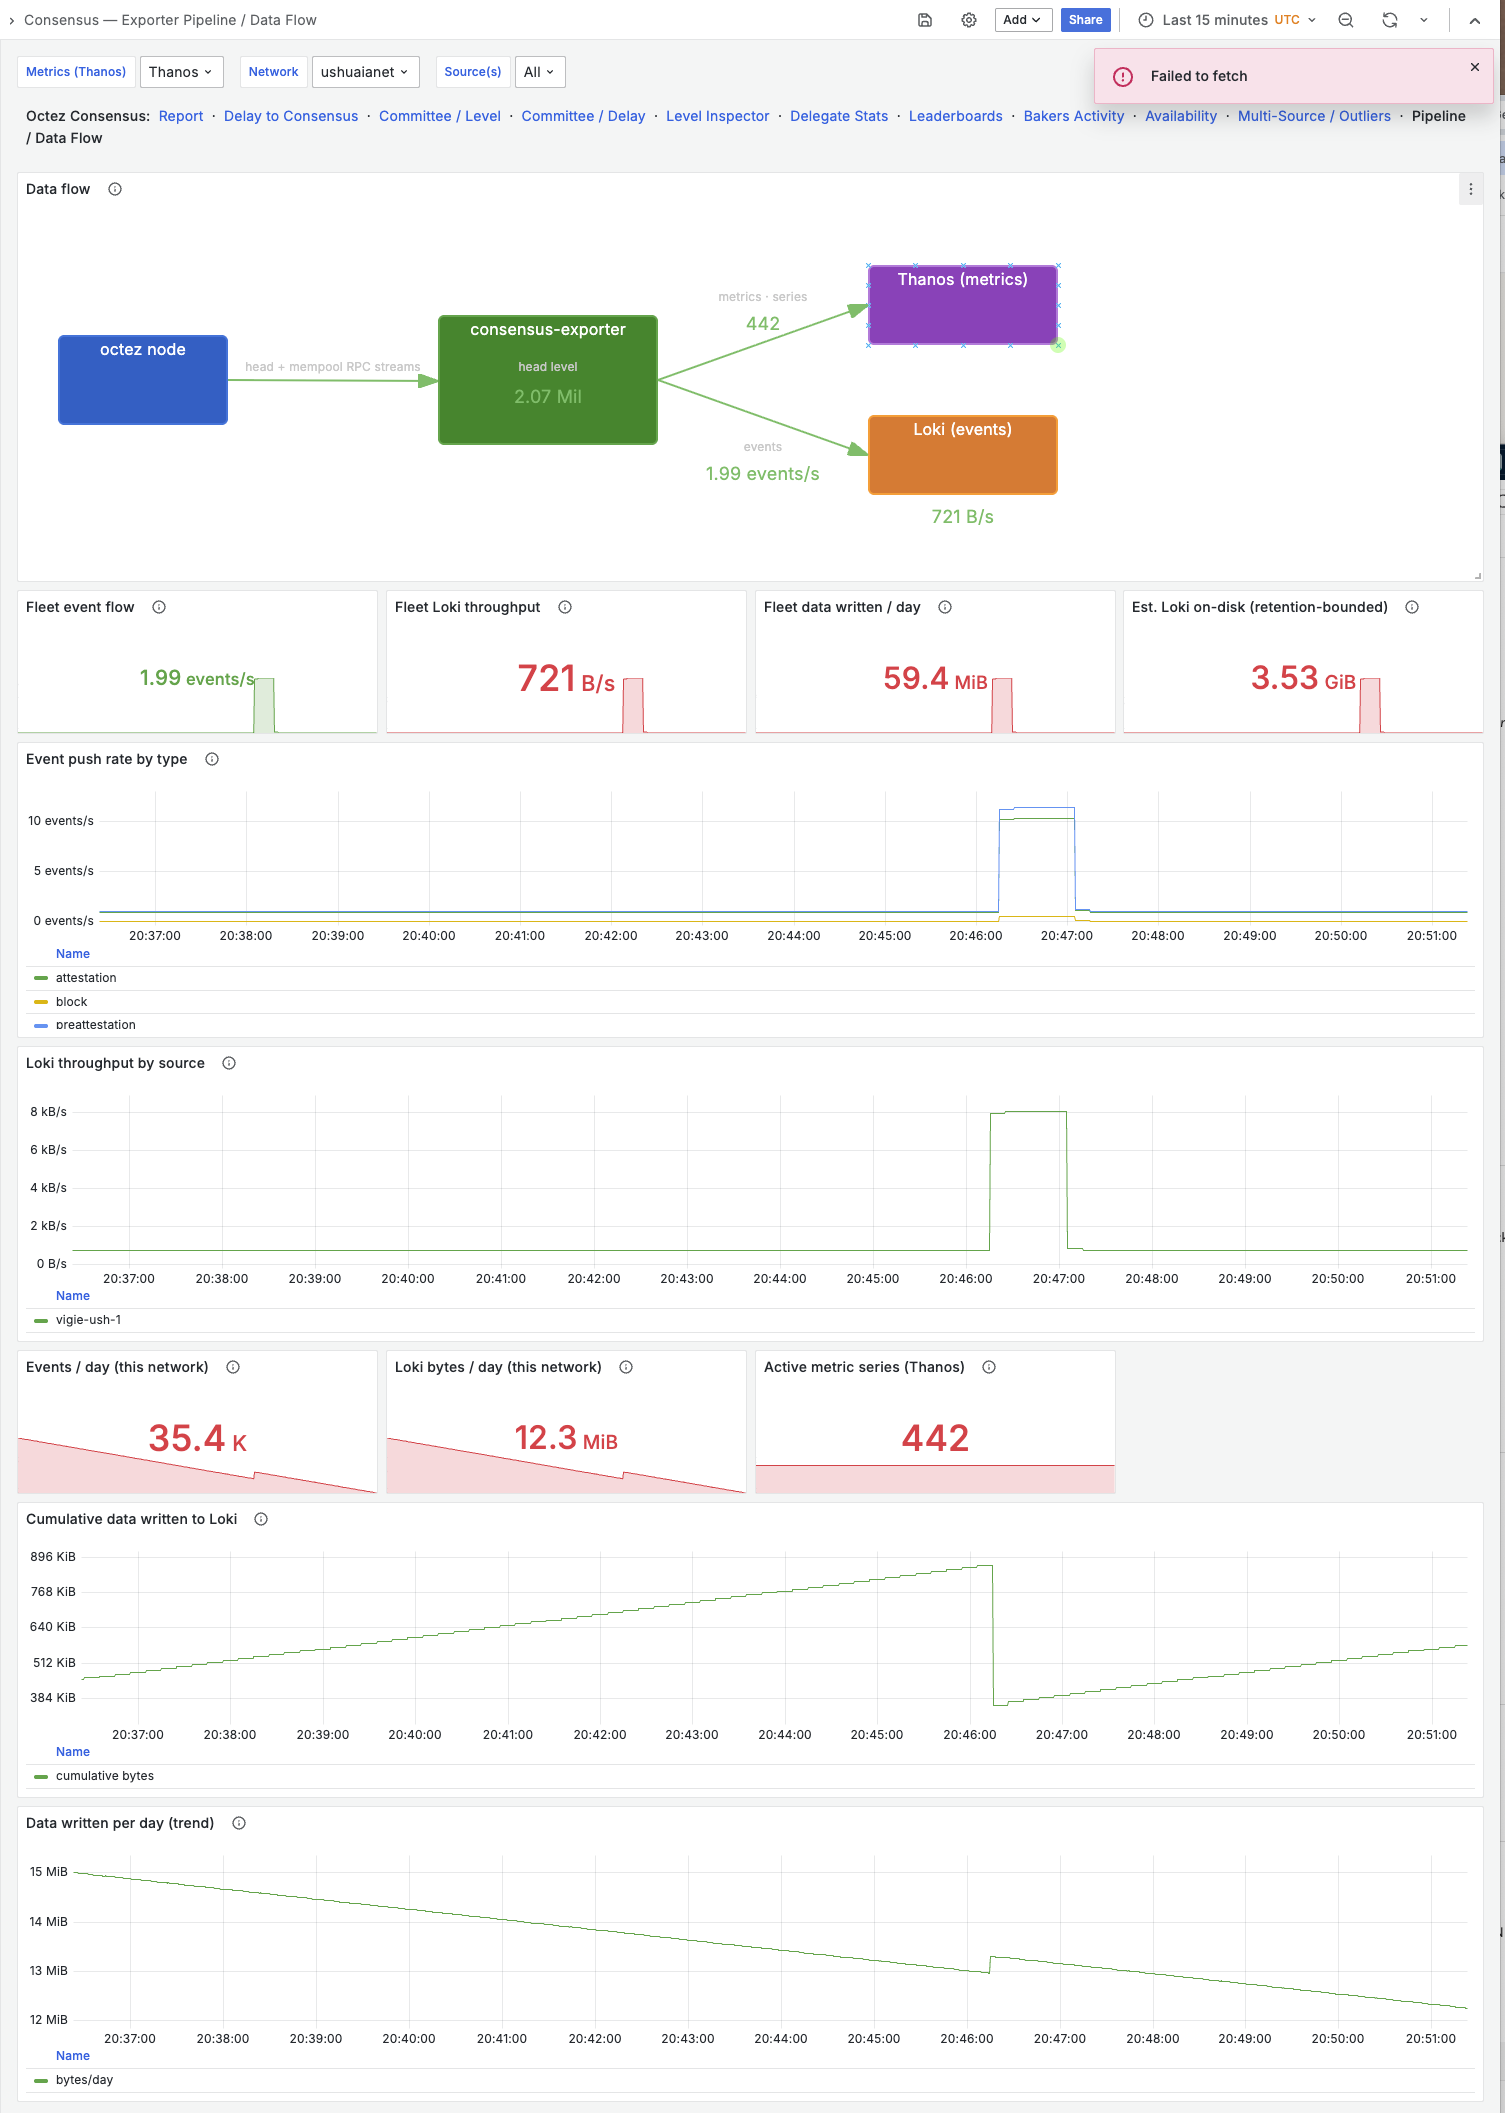
Self-observability: node → exporter → Thanos/Loki, event rates, Loki throughput and retention footprint.
More dashboards
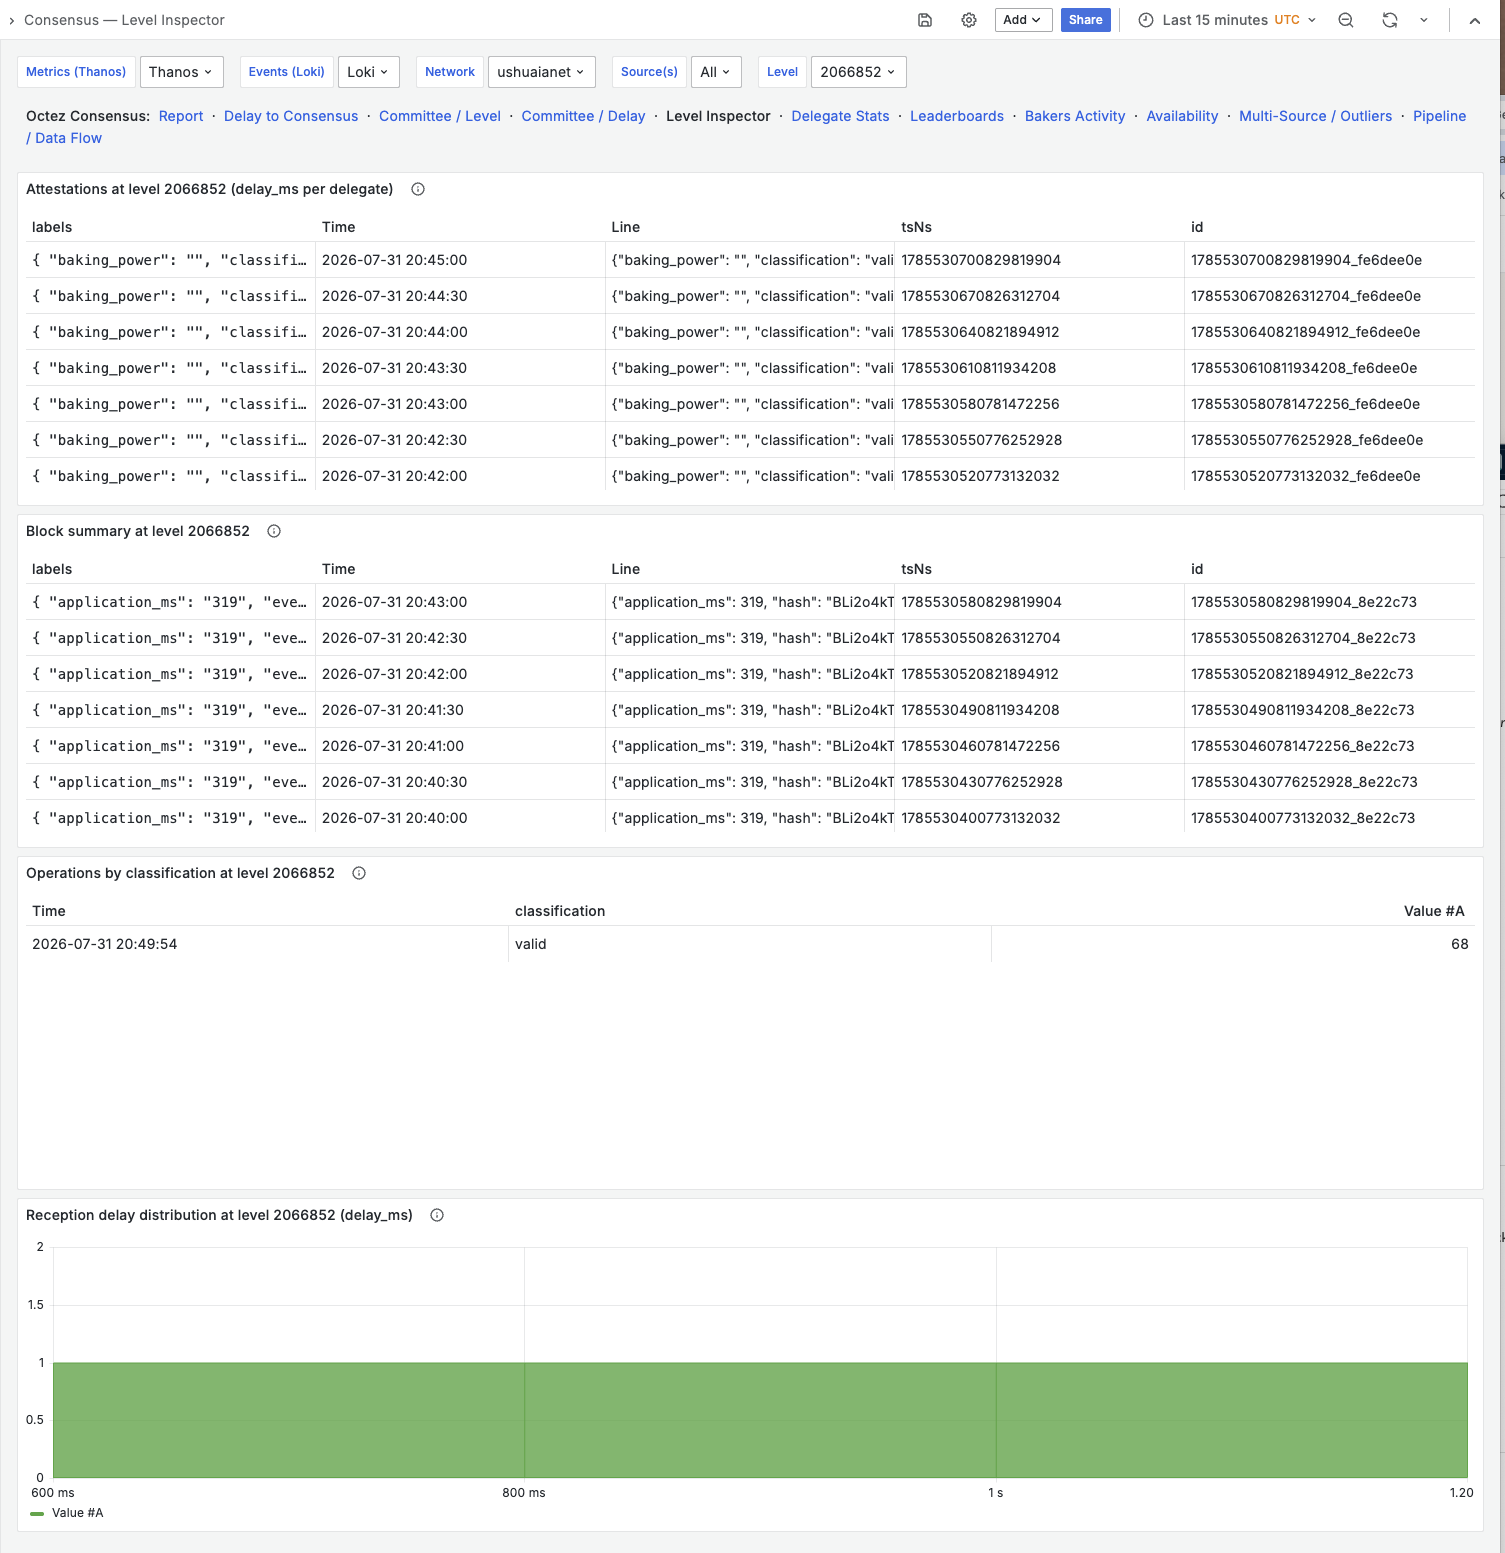
Level Inspector — exact attestations, block summary and delay distribution for one level.
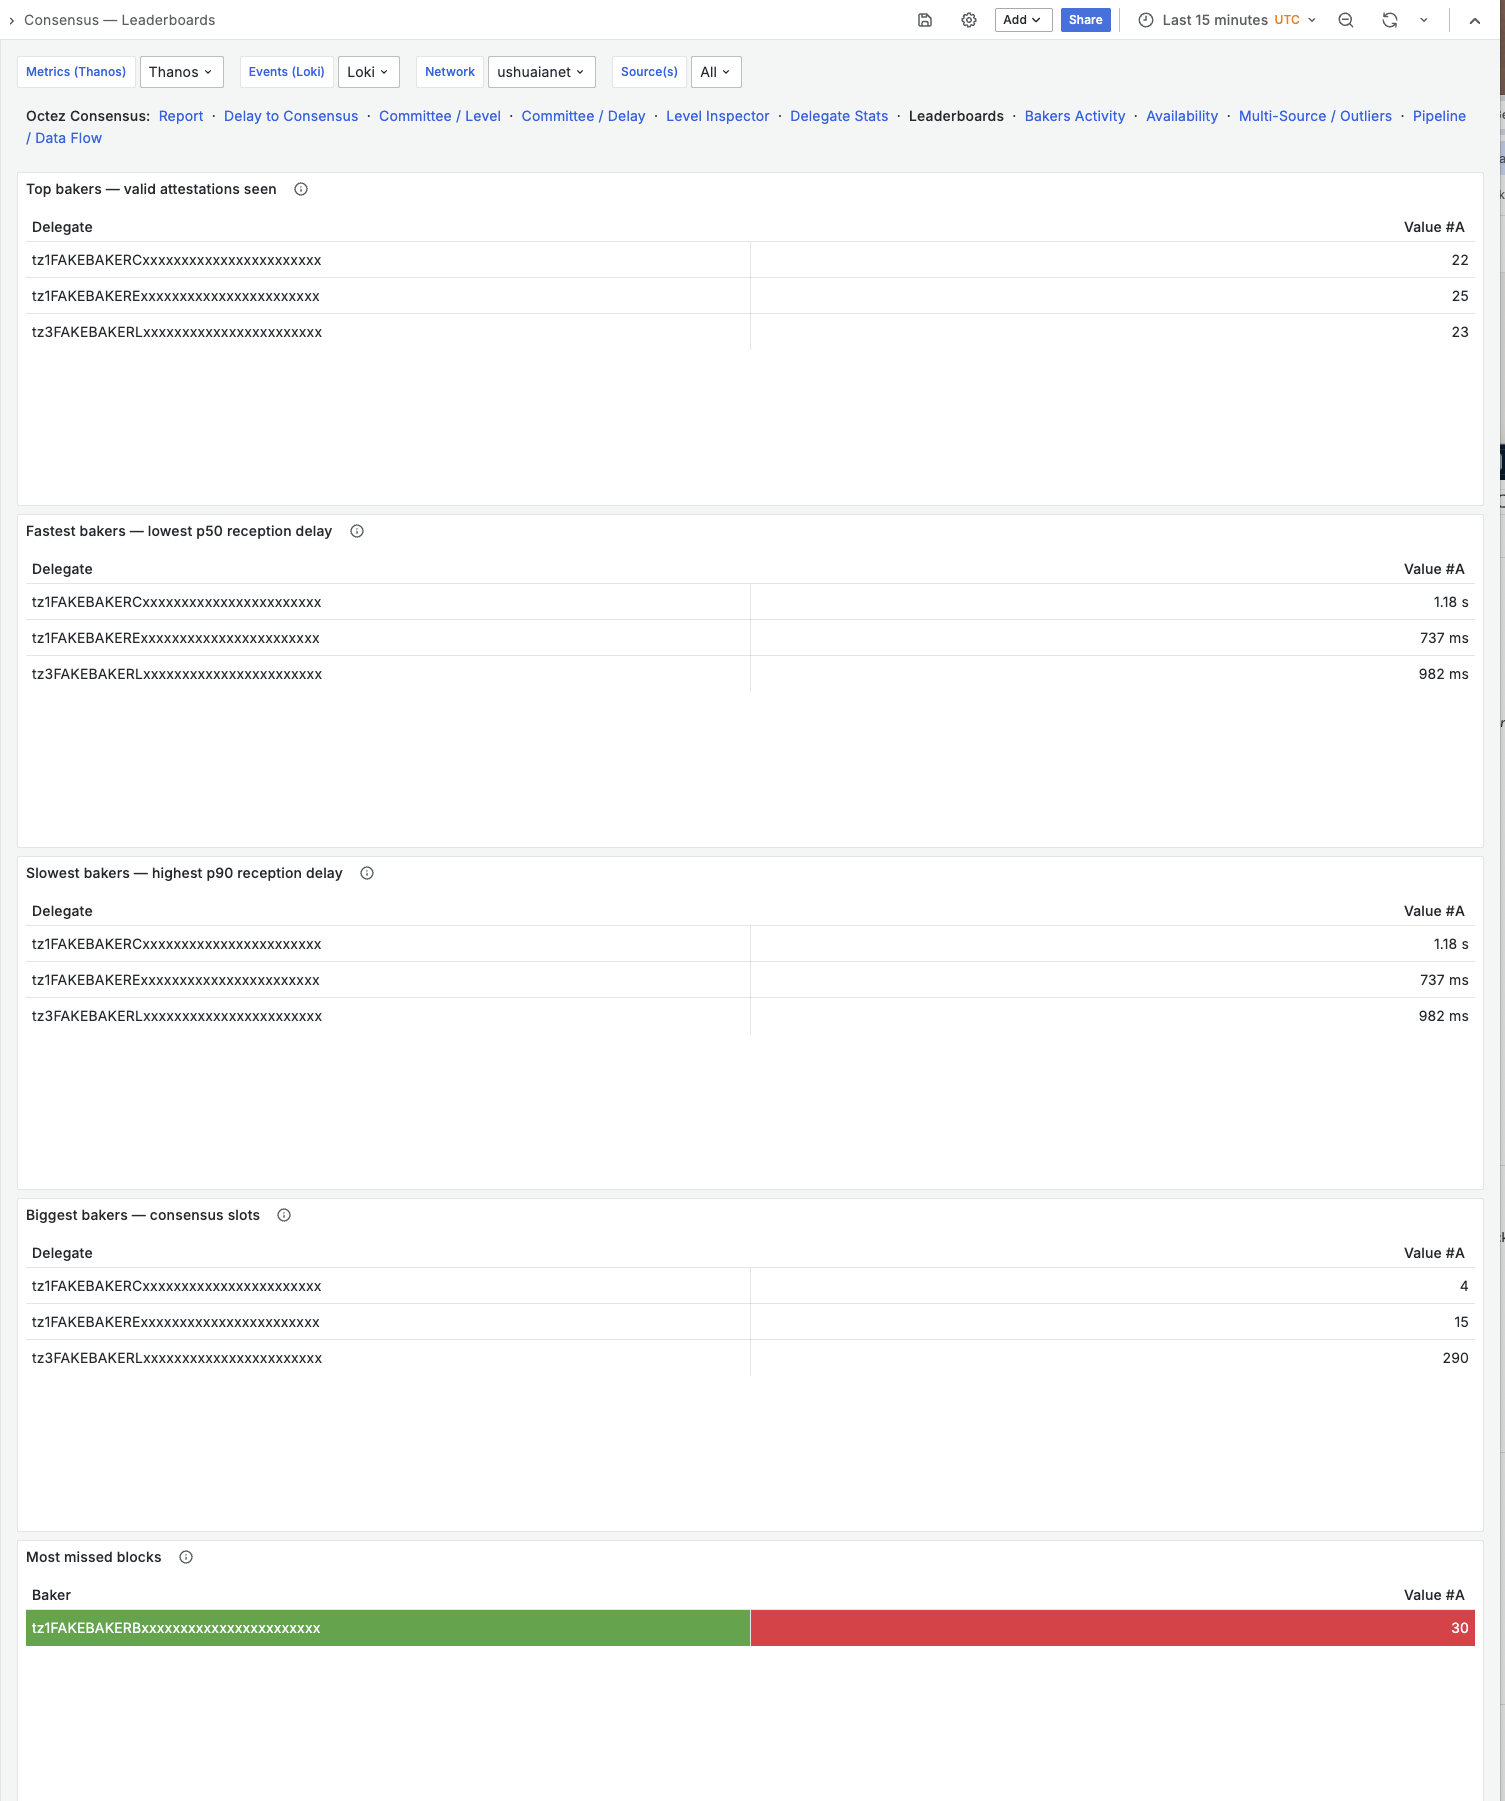
Leaderboards — top / fastest / slowest / biggest bakers, and most missed blocks.
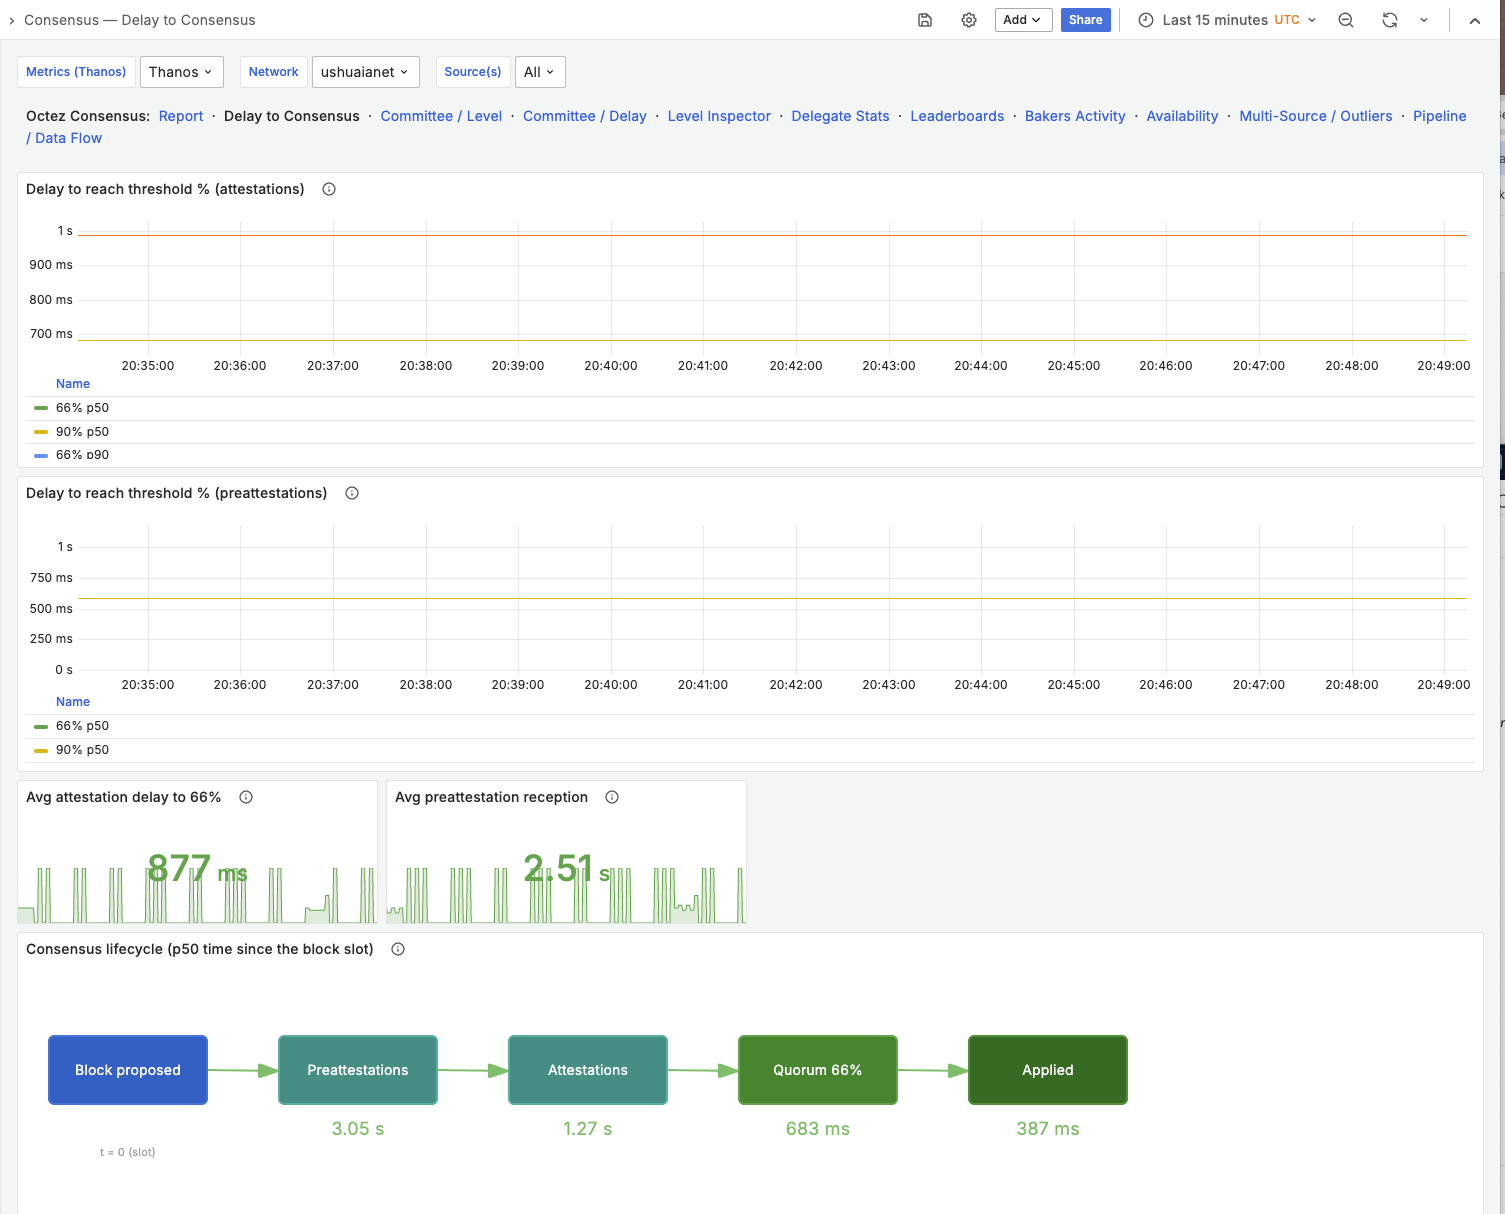
Delay to Consensus — time to reach the 66% / 90% power thresholds.
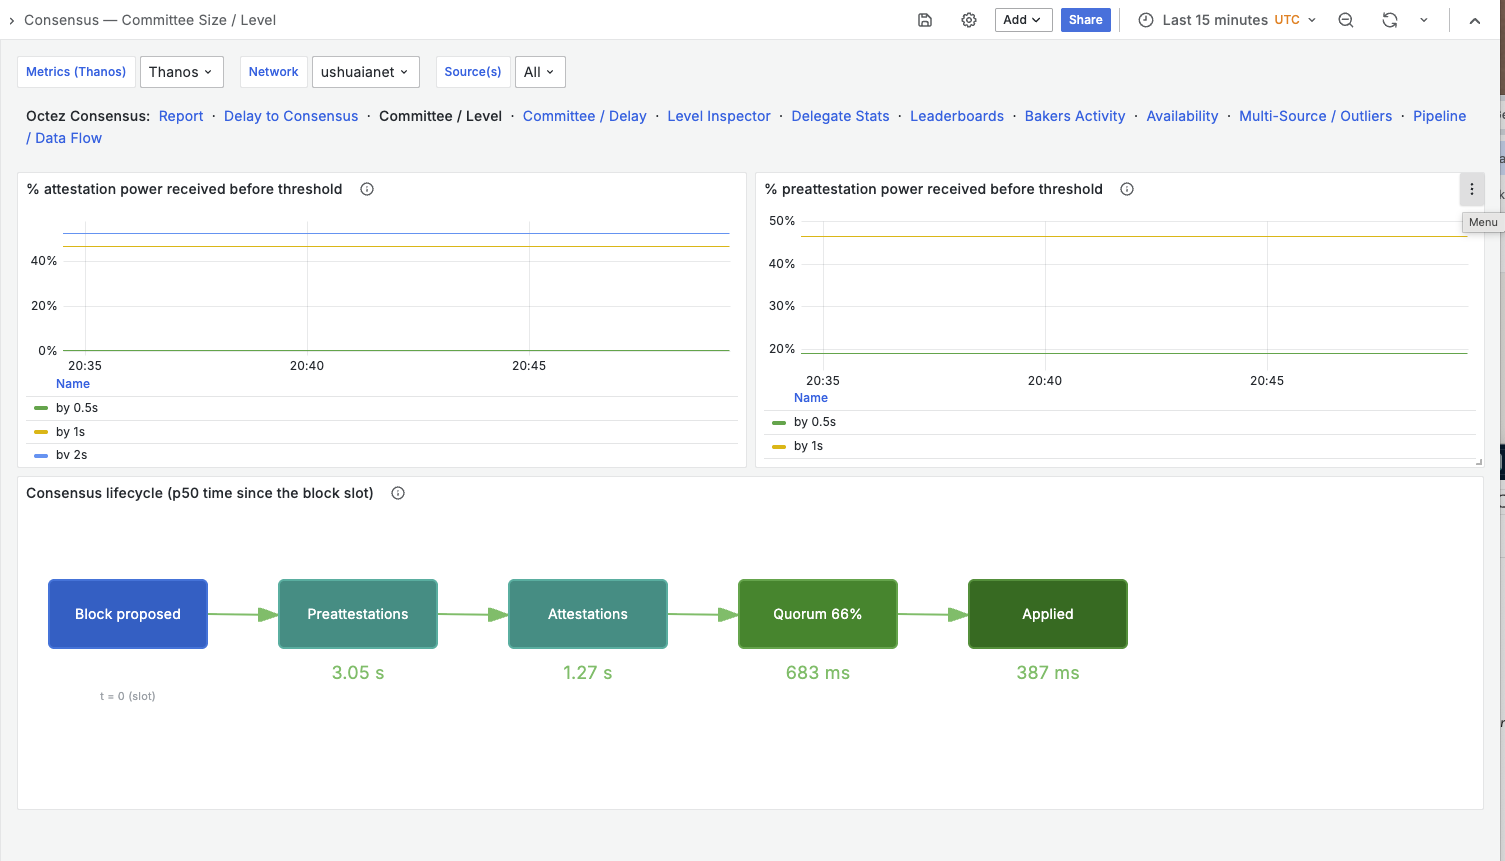
Committee Size / Level — % of power received before a temporal threshold.
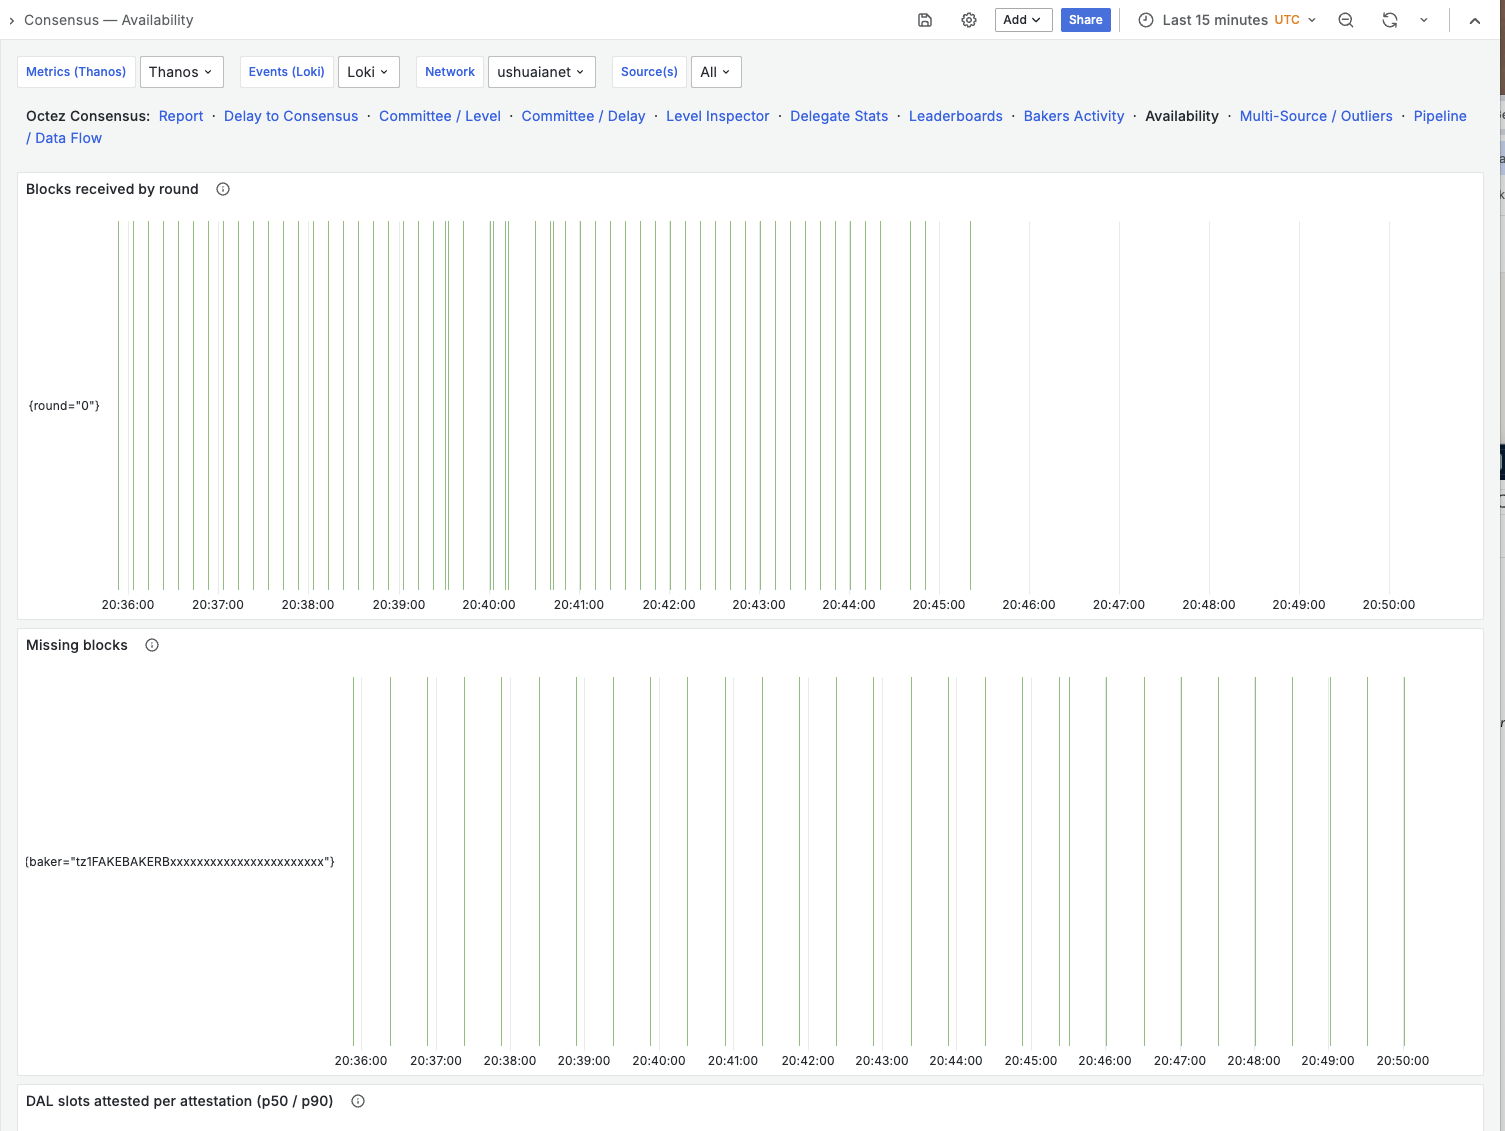
Availability — blocks by round, missing blocks per baker, DAL slots attested.
Deployment
Kubernetes via a Helm chart, reconciled by Argo CD. An ApplicationSet reads teztnets.com/teztnets.json and generates one node + exporter per public network — mainnet plus each active teztnet — picking up new testnets on the next reconcile. Currently monitoring mainnet, ushuaianet, shadownet and bakingnet, with DAL coverage on all four.
Open source and self-contained; issues and contributions welcome.
References
- Octez documentation — Welcome to the Octez and Protocol Documentation! — Octez & Protocol products documentation
- Tenderbake (Tezos consensus) — The consensus algorithm — Octez & Protocol products documentation
- Data Availability Layer (DAL) — The Data Availability Layer | Tezos Documentation
- teztnets — https://teztnets.com/
- teztale — Nomadic Labs / teztale · GitLab